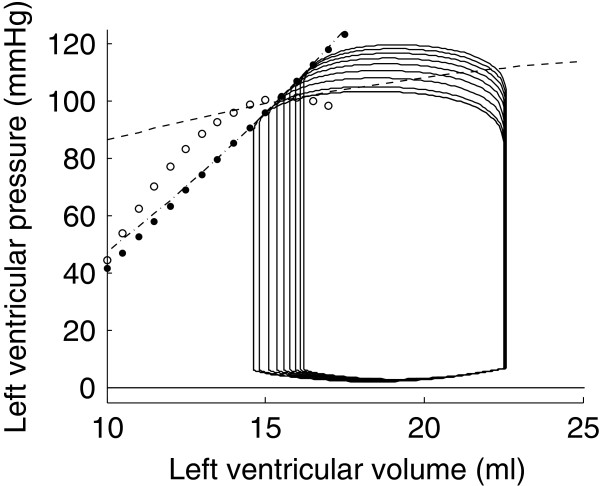
Figure 12.
Simulated left ventricular afterload increase by doubling systemic vascular resistance. The corresponding ESPVR is drawn in dotted line. The ESPVRs obtained by preload reduction simulations are displayed in dashed and white-dotted lines; the ESPVR obtained by afterload increase by doubling aortic elastance is displayed in dash-dotted line.

