
Figure 2.
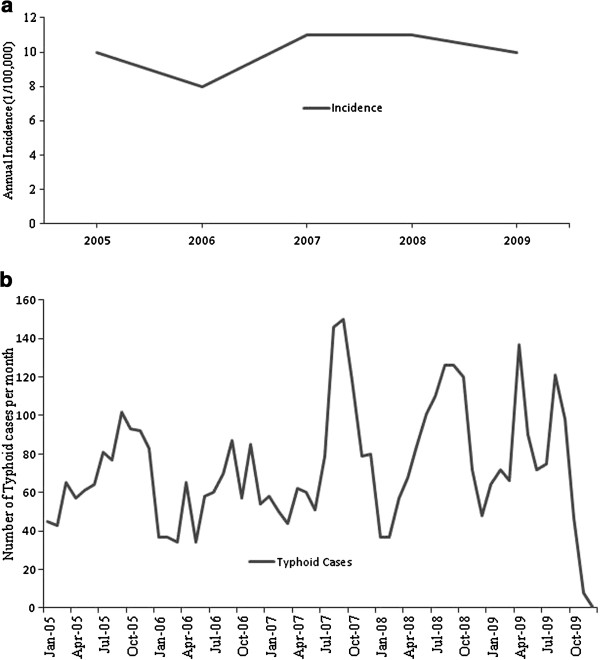
Temporal distribution of typhoid disease, 2005–2009. a) Annual incidence rates. b) Monthly cases.
Official websites use .gov
A
.gov website belongs to an official
government organization in the United States.
Secure .gov websites use HTTPS
A lock (
) or https:// means you've safely
connected to the .gov website. Share sensitive
information only on official, secure websites.
Temporal distribution of typhoid disease, 2005–2009. a) Annual incidence rates. b) Monthly cases.