
Figure 2. PhADE imaging of Fen1KikR visualizes the growth of individual replication bubbles.
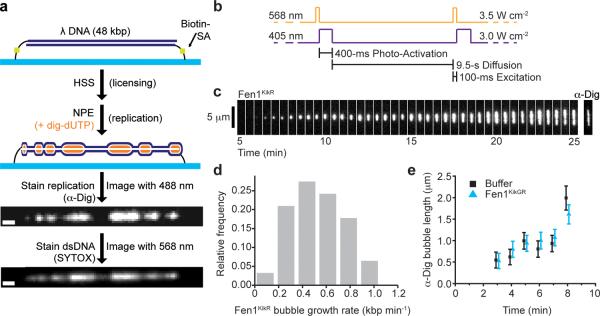
(a) Scheme for replication of surface-immobilized λ DNA by Xenopus egg extracts and detection of replication bubbles. λ DNA is attached to the bottom surface of a flow cell at both ends. Next, the DNA is licensed with HSS. Replication is promoted with NPE supplemented with dig-dUTP and, for PhADE imaging, Fen1KikGR. After real-time imaging of Fen1KikR (see below), the extracts are removed, and replicated DNA is stained with α-Dig and/or SYTOX Orange. Scale bar: 1 μm. (b) PhADE sequence used to visualize the growth of D179A Fen1KikR-labeled replication bubbles. (c) Replication was carried out in the presence of 4 μM D179A Fen1KikGR and Dig-dUTP under conditions of limited origin firing (Supplementary Fig. 4a–b). Between 5 and 25 minutes after the first NPE addition, D179A Fen1KikR was imaged every 10 s using PhADE. A sample kymograph shows every third frame of a replication bubble growing over time. After the last PhADE cycle, replicated DNA was stained with α-Dig. (d) Histogram of bubble growth rates tracked between 5 and 25 minutes displays a mean of 520 ± 220 bp min−1 (± s.d.), (n = 62 events from 3 independent experiments). (e) Average length of replication bubbles as measured by α-Dig staining, in the presence (blue triangles) or absence (black squares) of 2 μM D179A Fen1KikGR. Mean ± error estimate (see Online Methods). See also Supplementary Table 1.