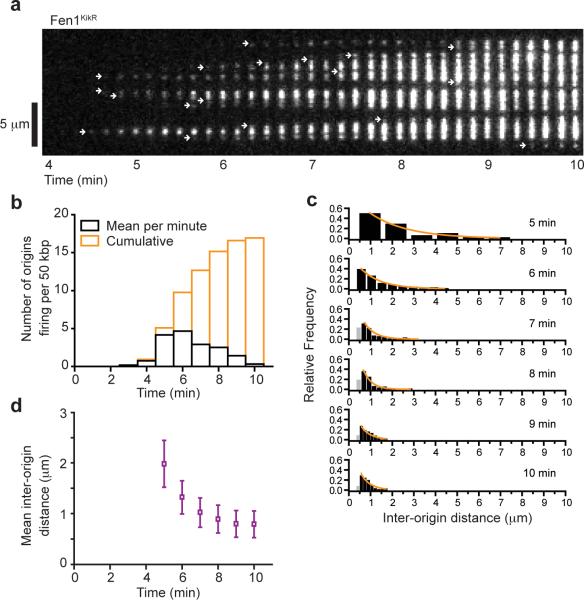
Figure 3. During unperturbed replication, PhADE imaging of Fen1KikR reveals a high density of initiations.
(a) Replication of λ DNA during unrestricted origin firing was monitored by PhADE imaging (as in Fig. 2b) of 2 μM D179A Fen1KikGR and displayed as a kymograph. White arrows indicate initiations. (b) PhADE kymographs as in Figure 3a were analyzed to determine the mean number of origins firing each minute (black) or cumulatively (orange) per λ DNA (n = 12 λ DNA). Similar results were obtained in a second extract (Supplementary Fig. 5c). (c) PhADE kymographs as in Figure 3a were analyzed to determine the distance between adjacent initiations over time. Black bars, reliable resolution limit (> 0.5 μm). Orange lines, single exponential decay fit to bars > 0.5 μm. (d) The mean inter-origin distance as determined from 12 replicating λ DNA molecules followed via D179A Fen1KikR PhADE declines over time. Mean ± error estimate (see Online Methods). Similar results were obtained in a second extract (Supplementary Fig. 5d).

