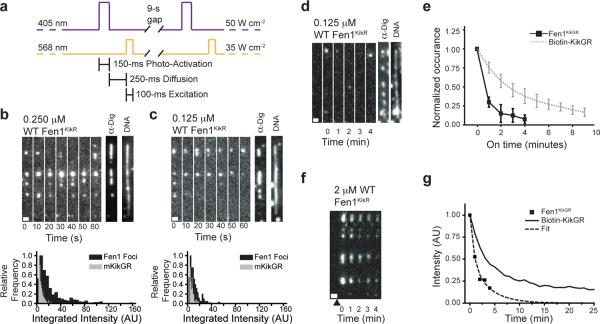
Figure 4. PhADE reveals single molecules of Fen1KikGR at replication forks and measures Fen1KikGR off rate from DNA.
(a) Imaging sequence for Figure 4b–c. (b) Replication in the presence of 0.25 μM WT Fen1KikGR. (top) A representative kymograph of Fen1KikR on λ DNA imaged every 10 s. After the final round of PhADE, replication bubbles and DNA were detected. 132 Fen1KikR foci were localized to 113 replication bubbles. Scale bar: 1 μm. (bottom) Intensity histogram of Fen1KikR foci on bubbles (black) versus single molecules of biotin-mKikR (gray). (c) As in Figure 4b but using 0.125 μM WT Fen1KikGR. 112 Fen1KikR foci were found on 129 replication bubbles. (d) DNA was replicated in the presence of 0.125 μM wild-type Fen1KikGR and Fen1KikR was imaged as in Supplementary Figure 7a before (first frame) and after photoactivation (frames 2–6). Afterwards, replication bubbles and DNA were detected. Scale bar: 1 μm. (e) The duration of wild-type Fen1KikR binding at replication bubbles is compared to the fluorescence on times of immobilized Biotin-mKikR. (wild-type Fen1KikR: mean ± s.d. of 3 experiments, n = 40 events; Biotin-mKikGR: mean ± s.d. of 6 experiments, n = 1,165 events, points are fit to a mono-exponential decay). (f) DNA was replicated in the presence of 2 μM WT Fen1KikGR. Fen1KikR was photoactivated once (black triangle) and imaged once a minute as depicted in Supplementary Figure 7c. Scale bar: 1 μm. (g) Normalized, integrated intensity of the region in Figure 4f (squares) is compared to Biotin-mKikR photobleaching (solid line) under the same imaging conditions. Biexponential fit (dashed line) reveals a mean life-time of 0.7 ± 0.3 min for Fen1KikGR on DNA.

