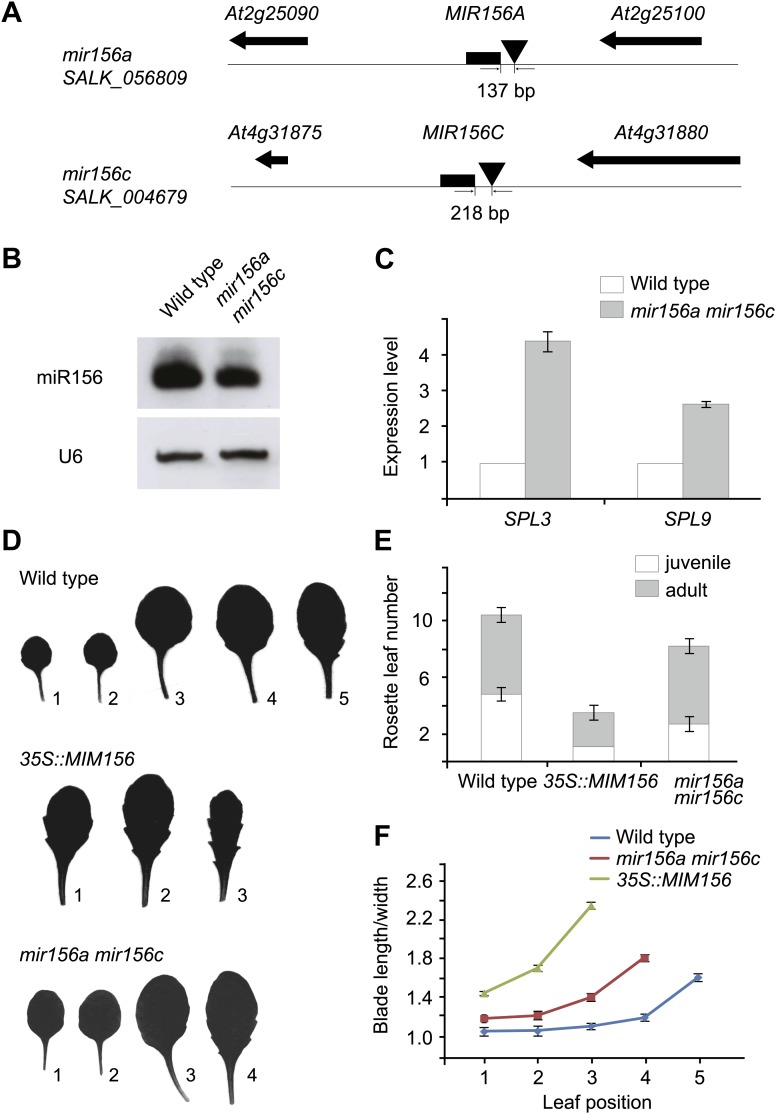
Figure 1. Phenotypic analyses of the mir156a mir156c double mutant.
(A) MIR156A and MIR156C genomic regions. Arrowheads mark T-DNA insertion sites. T-DNAs are inserted 137 bp and 218 bp upstream of the stem-loops of MIR156A and MIR156C, respectively. (B) Expression of miR156 in the wild type and the mir156a mir156c double mutant. U6 was monitored as loading control. (C) Expression of SPL3 and SPL9 in the wild type and the mir156a mir156c double mutant. The expression level in the wild type was set to 1.0. (D) Leaf morphology of wild type, mir156a mir156c, and 35S::MIM156 plants. The leaves were detached and scanned. The numbers indicate leaf positions. (E) The number of juvenile and adult leaves. n=12. (F) The length-to-width ratio of the blade. Fully expanded leaves were detached and scanned. The length and width of blades were measured. n=12. Error bars indicate SE.

