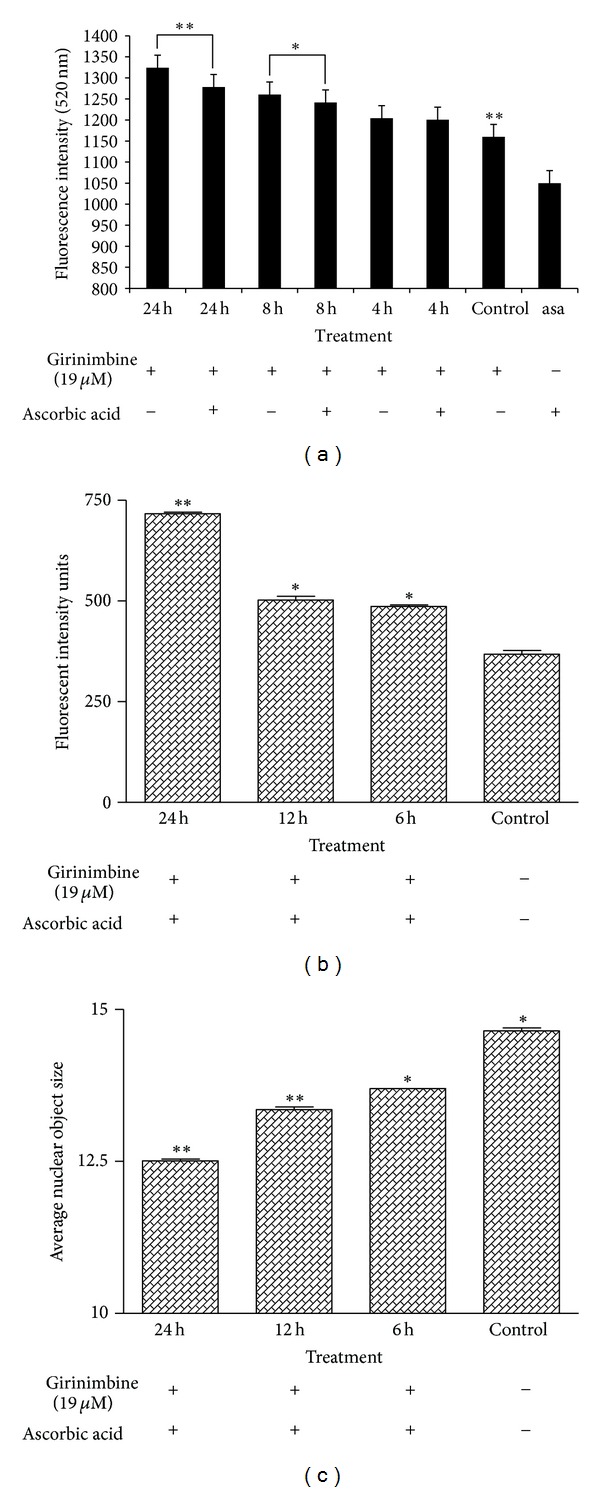
Figure 4.

Effects of girinimbine on A549 cells ROS generation. (a) DCF-fluorescence intensity after ascorbic acid and 19 μM of girinimbine exposure at 4, 8, and 24 h. Rate of apoptosis in terms of fluorescent intensity (b) and average nuclear object size (c) of nucleus of the girinimbine treatment was pretreated with 100 mM ascorbic acid. Values are mean ± SD from three independent experiments. Triplicates of each treatment group were used in each independent experiment. The statistical significance is expressed as **P < 0.01; *P < 0.05. Fluorescent intensity units directly represent the amount of ROS production.
