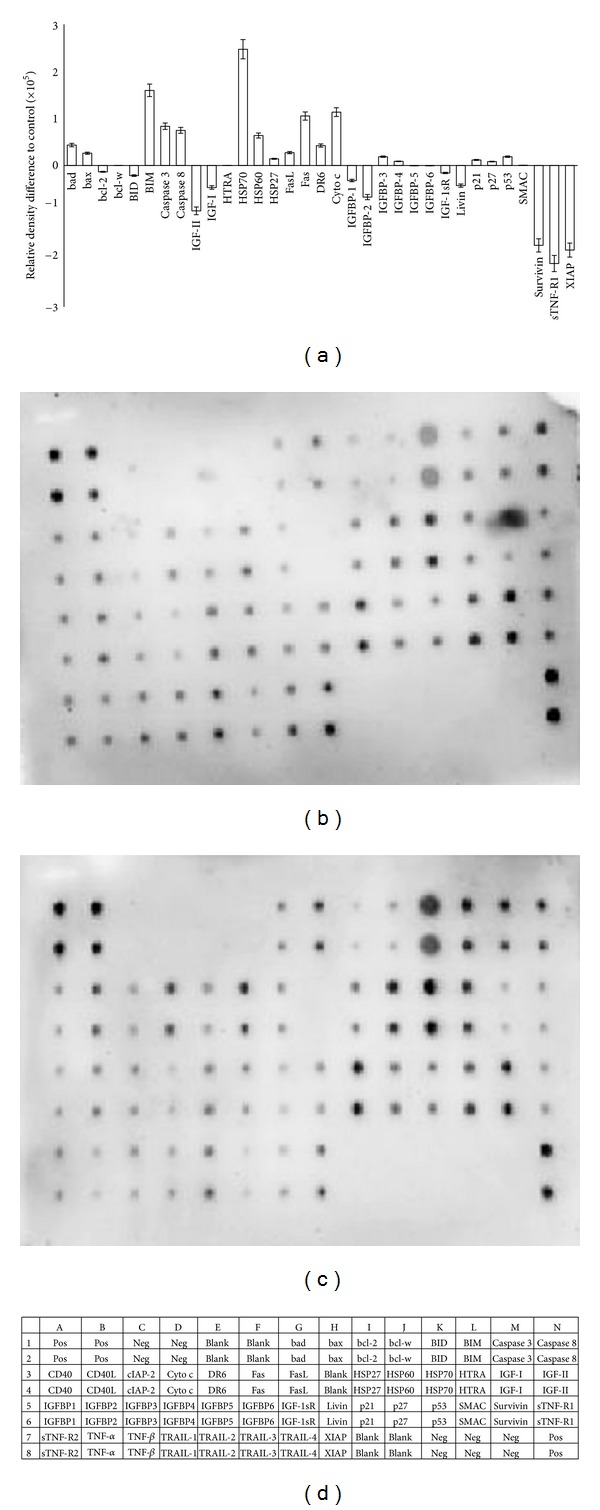
Figure 7.

Cells were lysed and protein arrays were performed. Cells was treated with 19 μM girinimbine for 24 h and the whole cell protein was extracted. Equal amount of (300 μg) of protein from each sample was used for the assay. Quantitative analysis in the arrays showed differences in the apoptotic markers (a). Representative images of the apoptotic protein array are shown for the control (b), treatment (c), and the exact protein name of each dot in the array (d).
