
Figure 6.
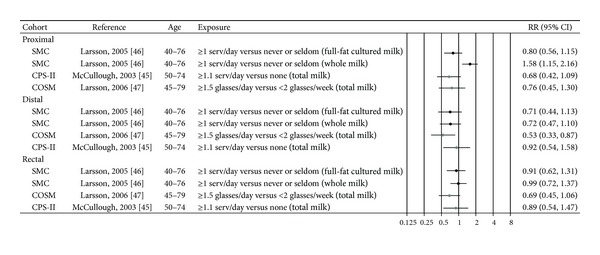
Estimates of relative risk with 95% CI for the highest versus the lowest exposure categories of milk. (The results are stratified on sex. Closed black circles: females. Closed grey circles: men. All estimates are sorted from the the lowest to the highest by subsite and sex.)