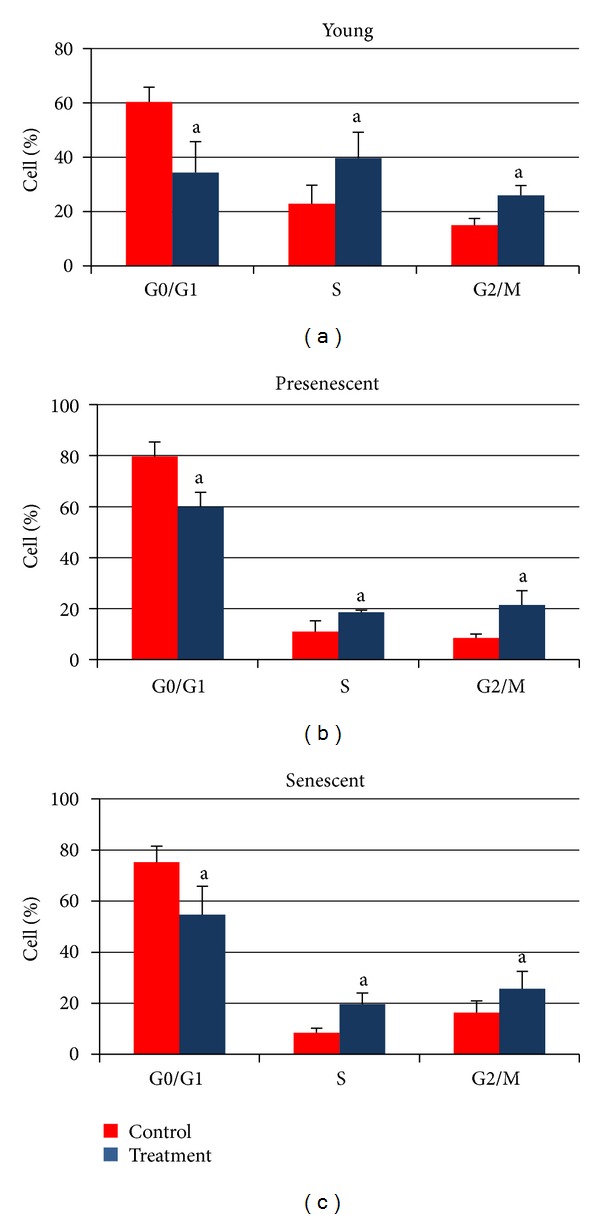
Figure 8.

Quantitative analysis of cell cycle progression in young, presenescent, and senescent HDFs with and without CV treatment. aDenotes P < 0.05 compared to untreated HDFs. Comparison was done between HDFs in the same phase of cell cycle. Data are expressed as means ± SD, n = 6.
