
Figure 1.
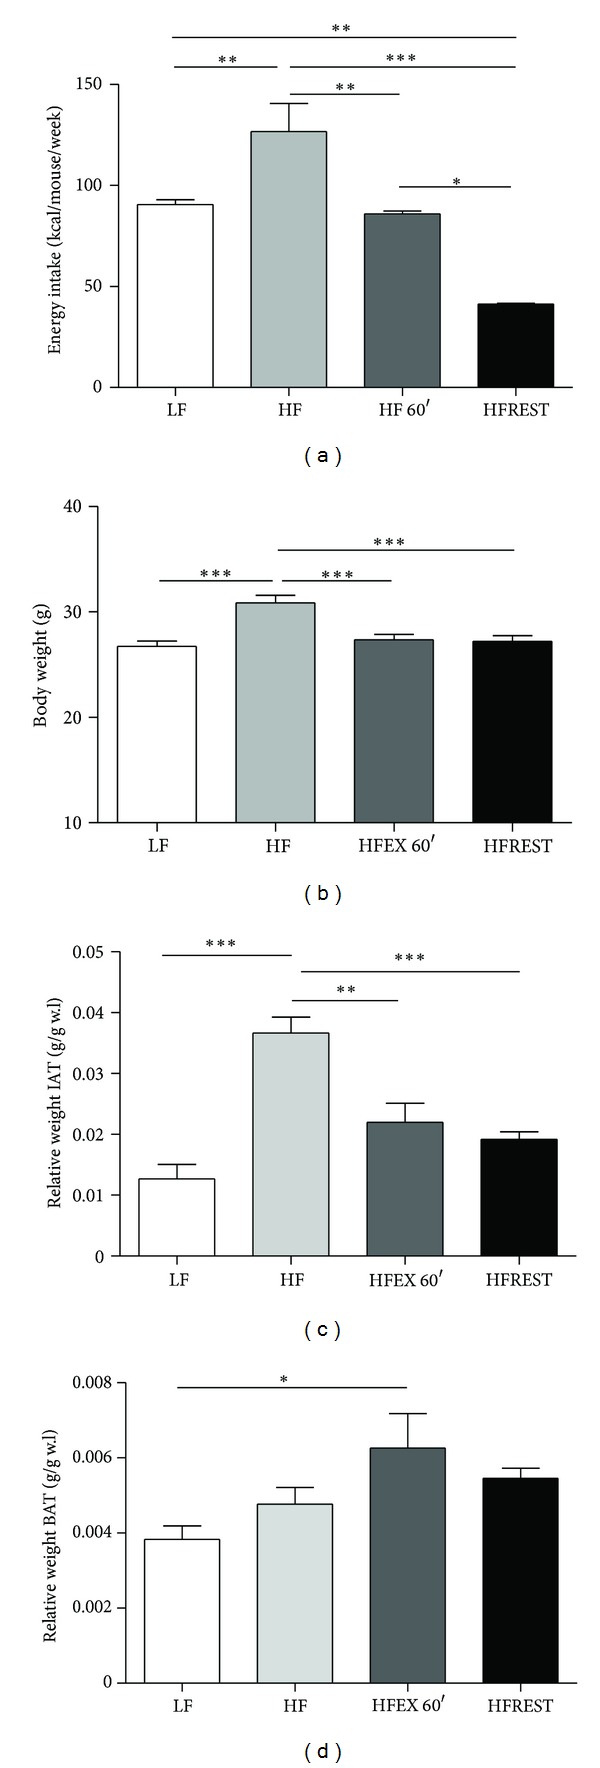
(a) Weekly caloric intake of animals subjected to the control diet (LF), high-fat diet (HF), high-fat diet with exercise (HFEX 60′), and high-fat diet with 30% food restriction (HFREST). (b) Mouse body weights (g). (c) Relative weight of IAT (inguinal adipose tissue). (d) Relative weight of BAT (brown adipose tissue). Mean ± SEM, n = 5 mice per group. ***P < 0.001, **P < 0.01, *P < 0.05.