
Figure 2.
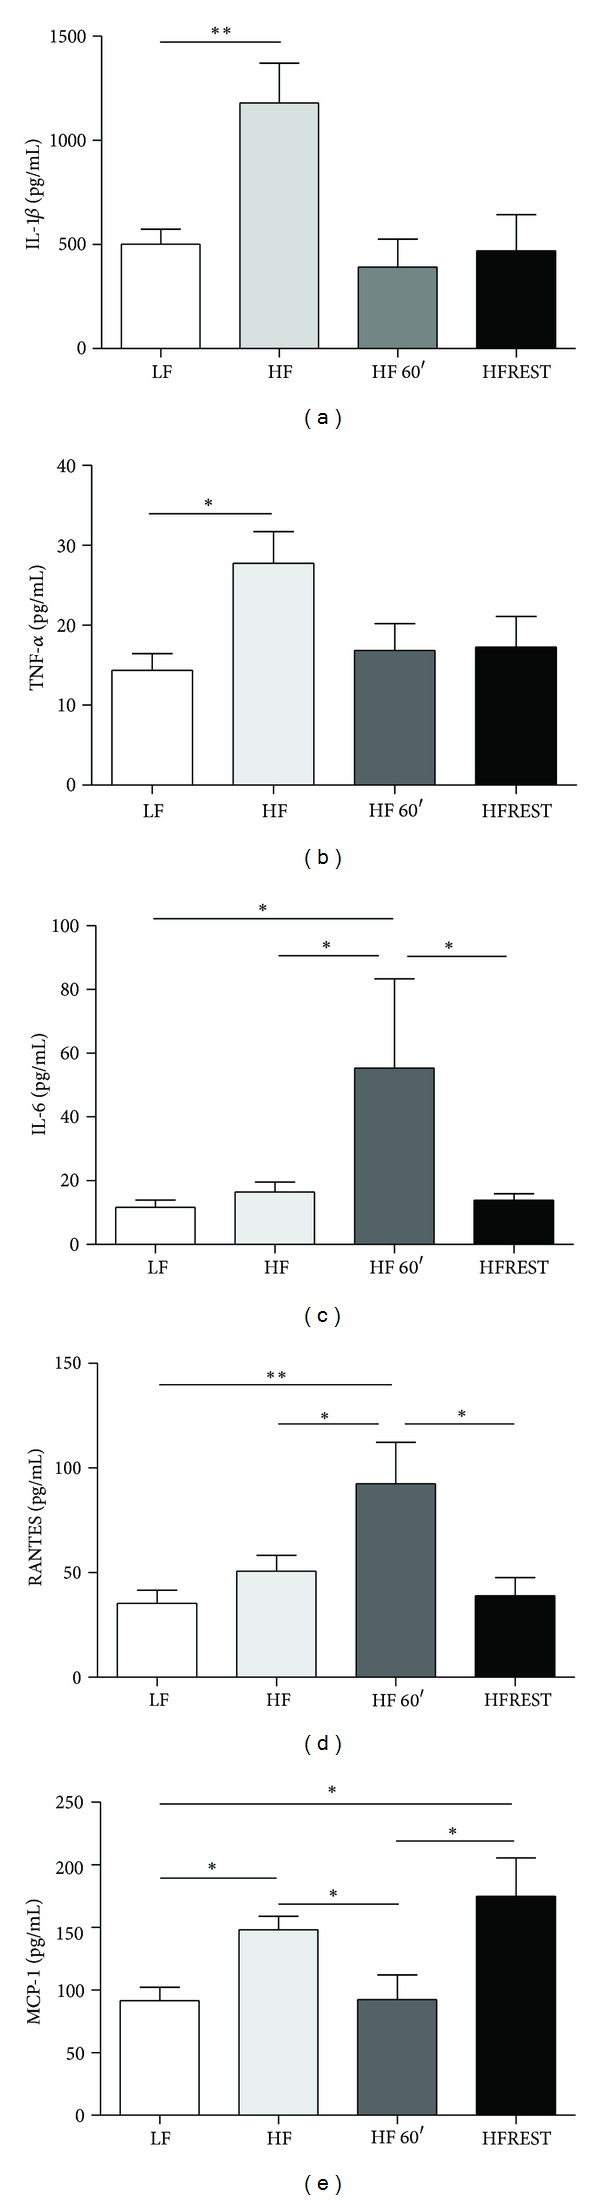
Cytokine concentrations (pg/mL) in mouse serum subjected to control diet (LF, n = 12), high-fat diet (HF, n = 12), high-fat diet with exercise 60′ (HFEX 60′, n = 8), and high-fat diet with 30% food restriction (HFREST, n = 8). (a) IL-1β, (b) TNF-α, (c) IL-6, (d) RANTES, and (e) MCP-1. Mean ± SEM. ***P < 0.001, **P < 0.01, *P < 0.05.