Figure 1.

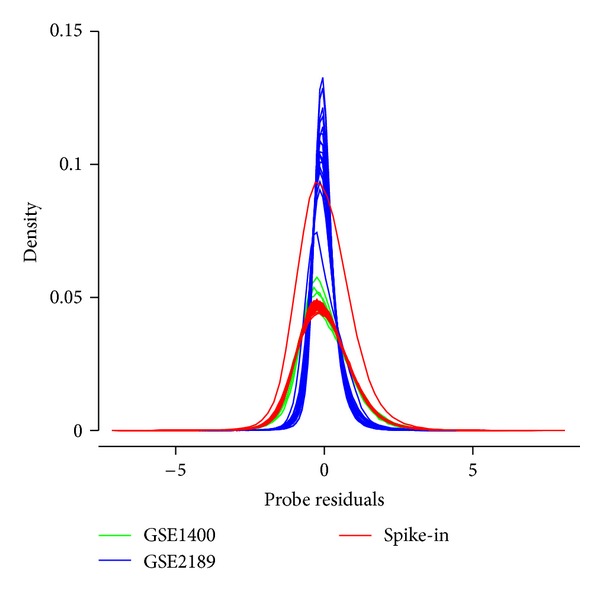
Empirical distributions of probe residuals R, as defined in the text, with one curve associated with each of the 66 arrays found in the three datasets. In each case, the mean residual is almost zero (|μ | <10−17).

Empirical distributions of probe residuals R, as defined in the text, with one curve associated with each of the 66 arrays found in the three datasets. In each case, the mean residual is almost zero (|μ | <10−17).