
Figure 1.
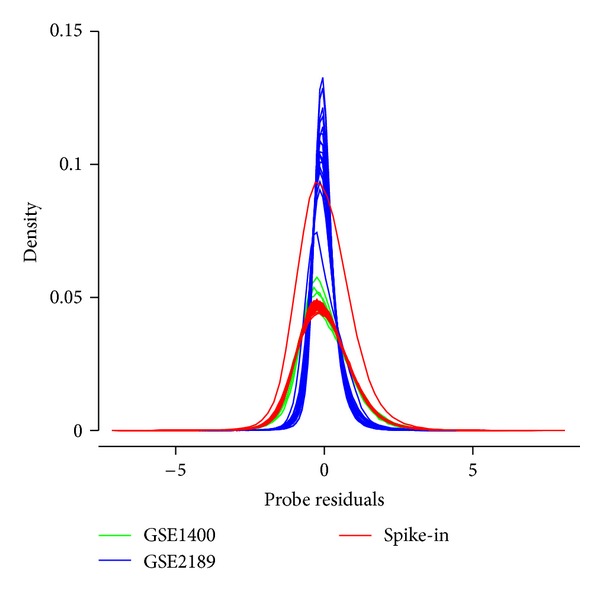
Empirical distributions of probe residuals R, as defined in the text, with one curve associated with each of the 66 arrays found in the three datasets. In each case, the mean residual is almost zero (|μ | <10−17).
Official websites use .gov
A
.gov website belongs to an official
government organization in the United States.
Secure .gov websites use HTTPS
A lock (
) or https:// means you've safely
connected to the .gov website. Share sensitive
information only on official, secure websites.
Empirical distributions of probe residuals R, as defined in the text, with one curve associated with each of the 66 arrays found in the three datasets. In each case, the mean residual is almost zero (|μ | <10−17).