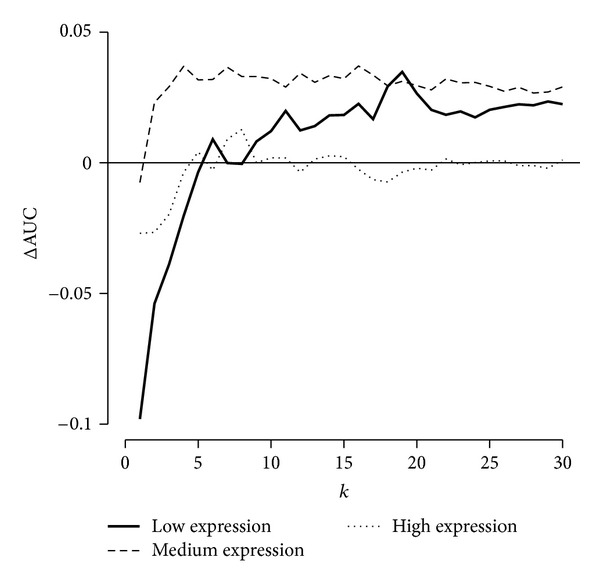
Figure 6.

Effect of k on DEG detection power. Difference between area under the curve (AUC) of receiver operating characteristic (ROC) curves computed in corrected data and AUC computed in original data, as a function of the value used for k, separately for low-, medium, and high-concentration spike-in genes. pyn improves low- and medium-concentration DEG detection power with k > 5, with optimal performance at k = 19, and has virtually no effect on high-concentration DEG detection power above k = 5.
