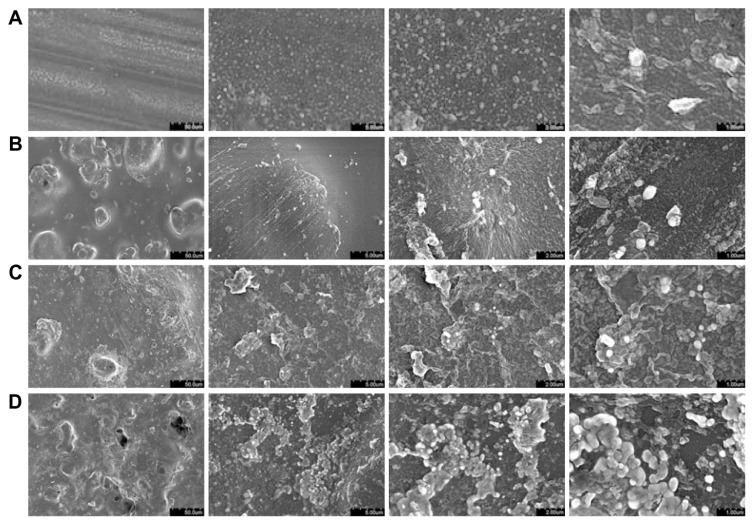
Figure 1.
Scanning electron micrographs of the nanocomposite samples.
Notes: Images reveal an increase in surface roughness and features at greater ZnO nanoparticle concentrations. The (A) 0%, (B) 10%, (C) 20%, and (D) 30% samples are shown at magnifications of (from left to right) ×1000, ×10,000, ×20,000, and ×40,000.

