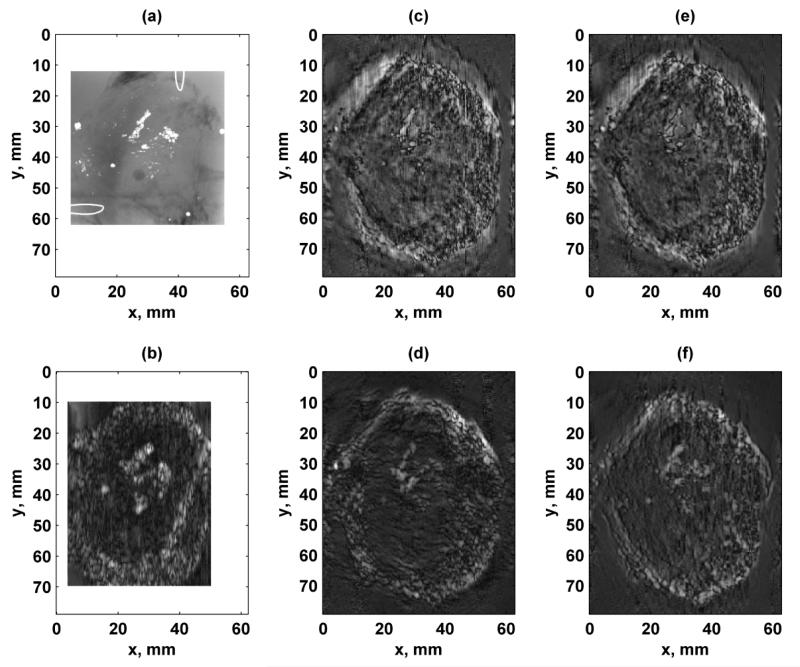
Figure 12.
Images of ex vivo human prostate with different configurations. (a) X-ray of prostate where calcium clusters are white. Wire loops in upper right and lower left corners are fiducial markers. The X-ray image is 50.0 × 50.0 mm, (b) VA image acquired using linear array transducer with f1 = 3.64 MHz and Δf = 54.3 kHz. White borders were placed around the X-ray and linear array images to make the full images of a comparable size with the images formed with the 1.75D array, (c) Configuration 1, (d) Configuration 2, (e) Configuration 3, (f) Configuration 4. The azimuthal direction of the linear and 1.75D array transducers corresponds to the horizontal axis of the image and the mechanical translation of the transducer in the elevation direction corresponds to the vertical axis. [Images in (a) and (b) were adapted from [15]. © 2011 IEEE.]

