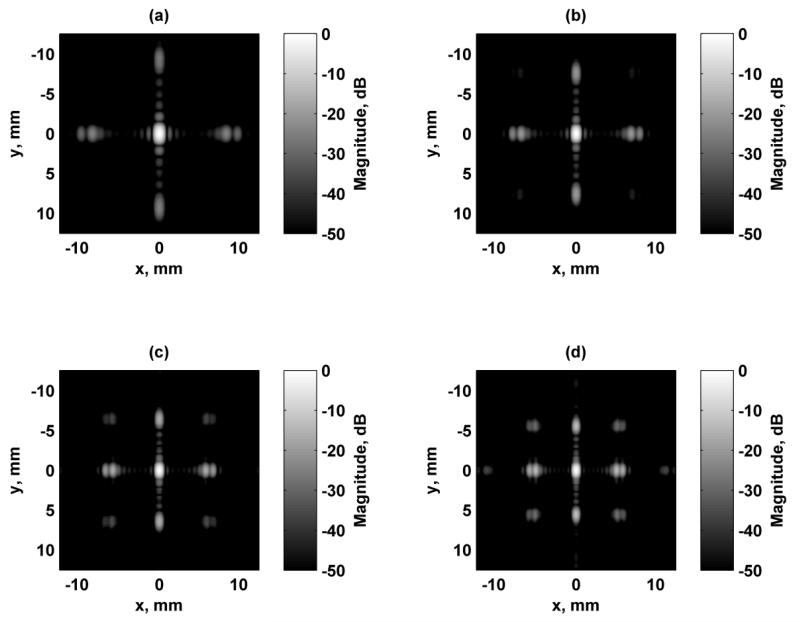
Figure 3.
Comparison of simulated excitation fields in the focal plane (x-y) for different ultrasound frequencies using Configuration 4. All figures are independently normalized and displayed on a logarithmic scale for better visualization of the grating lobes. For all cases, Δf = 50 kHz. (a) f1 = 5 MHz, (b) f1 = 6 MHz, (c) f1 = 7 MHz, (d) f1 = 8 MHz.

