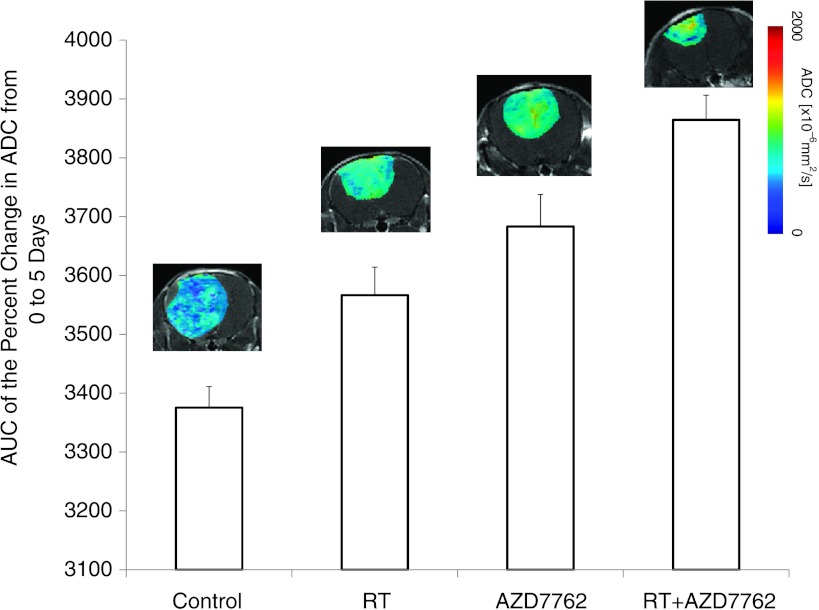
Figure 5.
DW-MRI during the first 5 days of posttreatment initiation. The mean DW-MRI-derived ADC values for each of the treatment groups were obtained by AUC analysis of tumor ADC values from pretreatment to day 5 posttreatment initiation. Error bars represent SEM. RT and AZD7762 treatment groups were significantly different from the control group and the RT + AZD7762 group was significantly different from the ionizing radiation (IR; P <.001), AZD7767 (P < .02), and control (P <.001) groups at day 5. Color ADC overlay maps from representative tumors treated for 5 days are shown for each of the individual groups.

