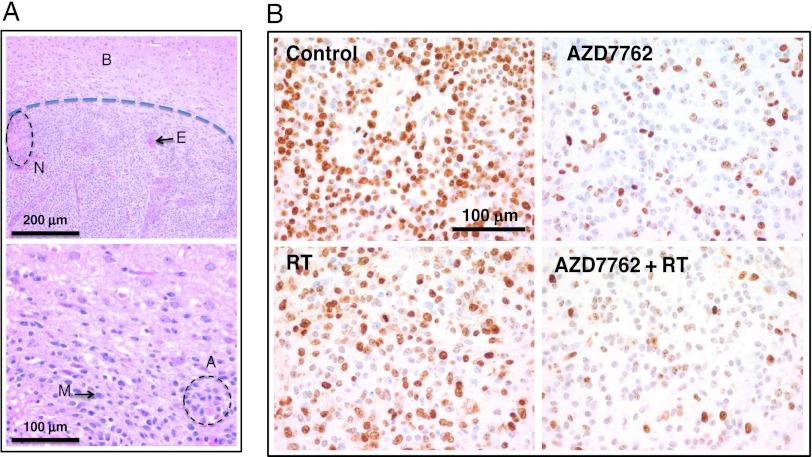
Figure 6.
Histologic effects of AZD7762. (A) H&E-stained sections of control (vehicle-treated) tumors isolated at the end of the treatment schedule. The dashed line in the top panel represents that border between normal brain tissue (B) and the tumor. Tumors display typical hallmarks of human GBM, including areas of necrosis (N), endothelial proliferation (E), mitoses (M), and atypia (A). Top panel represents images taken at x10 magnification, while the bottom panel is x40. (B) Ki67 staining performed on tumor sections isolated from day 2 for the different treatment groups from Figure 4B (n = 4 per treatment group). Representative images are shown. Control (vehicle) tumors demonstrated high levels of Ki67-positive cells. RT induced modest decreases in Ki67 staining. However, treatment with AZD7762 resulted in marked decreases in the proportion of Ki67-positive cells. Sold bars are provided for magnification.

