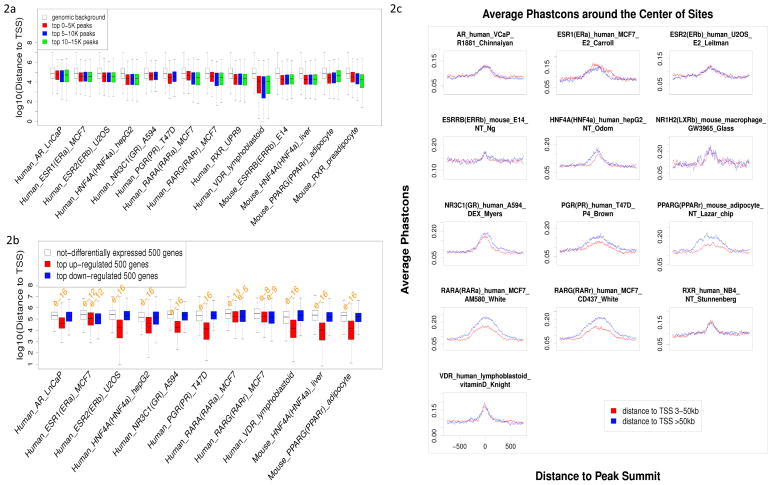
Figure 2.
(a) Top 0–5 K/5–10 K/10–15 K peaks (ranked by p-values from small to large) were compared by their distances to the nearest genes, and all the NRs with at least one dataset of over 10 K peaks are included. No significant differences in peak distance were observed among the three groups. (b) Two groups of genes (upregulated and downregulated; 500 genes) were compared to one group (nondifferentially expressed; 500 genes) by their distances to the nearest peaks, and all the NRs with at least one ChIP-chip/seq dataset coupled with de/activation experimental dataset were included. Wilcoxon rank sum test was utilized to test significance of distance disparity; significantly small p-values are marked above the corresponding boxplot. For all the NRs, upregulated genes were closer to binding sites than nondifferentially expressed genes; however, similar phenomena were observed in downregulated genes only for ESR1, RARA and RARG. (c)
Average phasCons conservation score profiles around the 1,200 bp summits of NR binding sites. Two groups of binding sites, with different distances to theirs nearest genes, were compared by their phasCons conservation score profiles, and no significant variations were observed.

