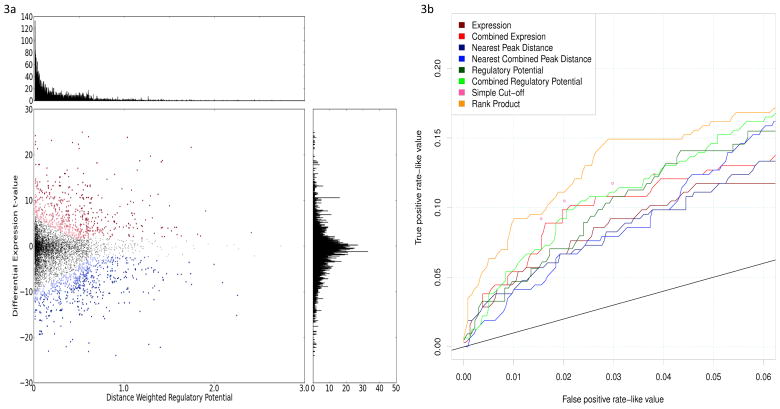
Figure 3.
(a) Scatter plot of genes represented by two parameters: the regulatory potential calculated from Brown labs’s ER ChIP-chip dataset and the differential expression t-value calculated from Brown lab’s expression dataset of 12hr estrogen treatment. Rank product method was utilized to integrate the two paramaters and render a rank order list of genes according to their likelihoods of being ER targets. Red dots represent the top 800 genes that are most likely to be upregulated ER targets; red dots with darker colors are more likely to be targets than those with lighter colors. Similarly, blue dots represent the top 800 genes that are most likely to be downregulated ER targets; blue dots with darker colors are more likely to be targets than those with lighter colors. The horizontal histogram represents the distribution of regulatory potential, and the vertical histogram represents the distribution differential expression values. (b) ROC-like curve for ESR1 as a validation of our integrated target prediction method. We calculated the correlation values of all the other genes with ESR1 using van de Vijver’s breast tumor expression data, and defined genes with expression correlations larger than 0.3 as true positives and those with correlations between −0.2 and 0.2 as true negatives. ESR1 target genes predicted by different approaches were compared.

