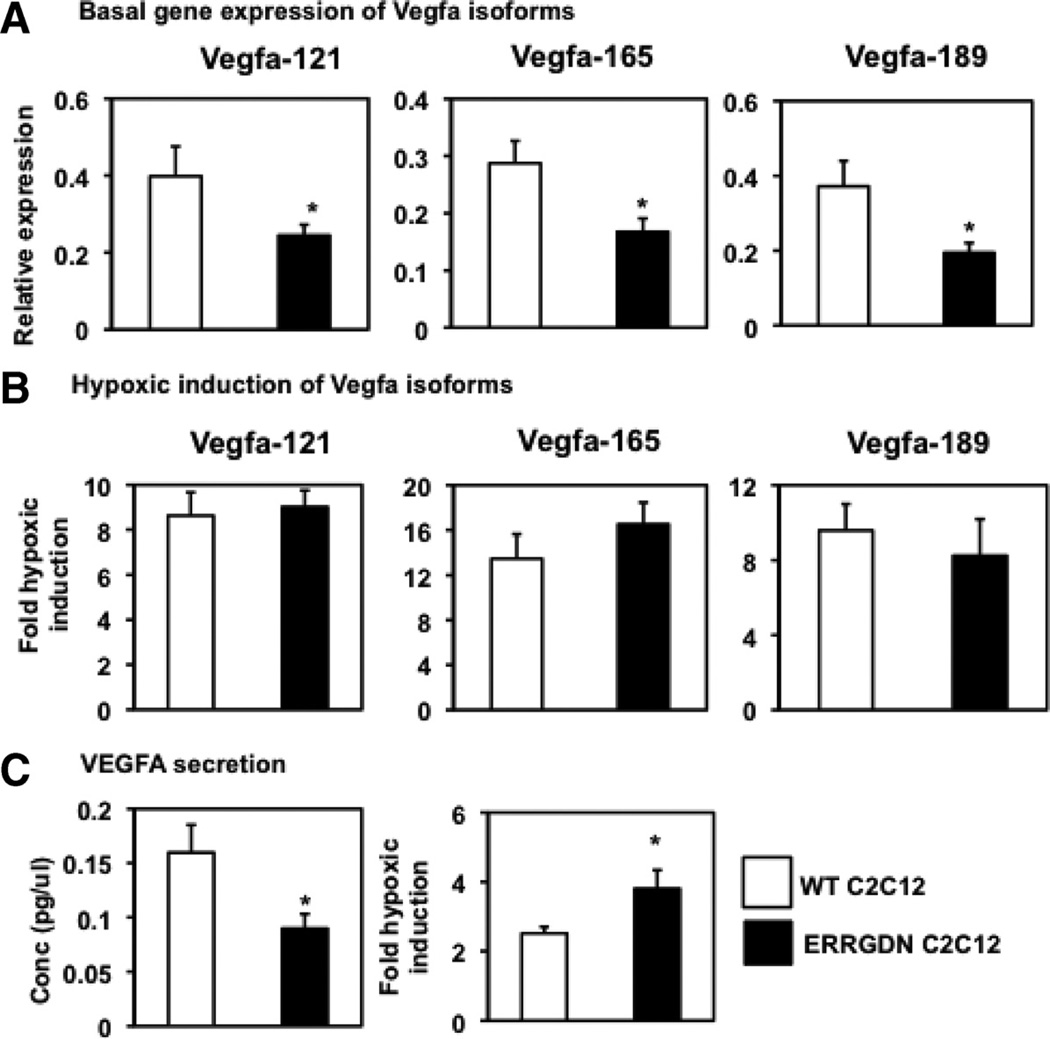
Figure 7. Hypoxic response in C2C12 cells.
Measurements were made in wild-type (open bars) and dominant-negative estrogen-related receptor-γ (ERRGDN) overexpressing (black bars) C2C12 cells. A, Basal expression of Vegfa121, Vegfa165, and Vegfa189 genes in C2C12 cells. B, Fold induction of Vegfa121, Vegfa165, and Vegfa189 gene expression in C2C12 cells by 24 hours of hypoxia (N=4 per group). C, Basal levels of Vegfa secretion by C2C12 cells in culture medium and fold induction in Vegfa secretion by C2C12 cells subjected to 24 hours of hypoxia. Values are represented as mean±standard deviation from n=4 experiments. *Statistically significant difference between WT C2C12 and ERRGDN C2C12 cells (P<0.05, unpaired Student t test).

