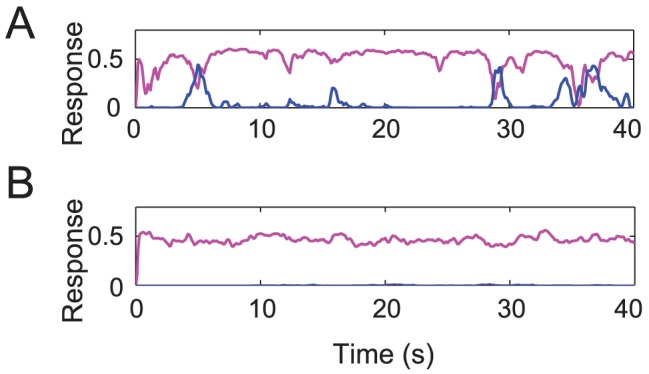
Figure 3. Reliability of simulated binocular layer responses to monocular gratings.

(A) Example responses to a monocular grating for one of the 6 parameterizations of the conventional model that passed the initial two criteria (see Methods ). Magenta, simulated response time-course for a neuron tuned to the orientation of the monocular grating. Cyan, simulated response time-course for a neuron with orthogonal orientation preference. While this parameterization of the model produced stronger rivalry for dichoptic gratings compared to plaids, the model behaved implausibly when presented with a monocular grating. Specifically, the model occasionally showed stronger responses for the non-presented orthogonal grating. (B) Simulated responses of the opponency model were stable, and did not any show any switches in dominance.
