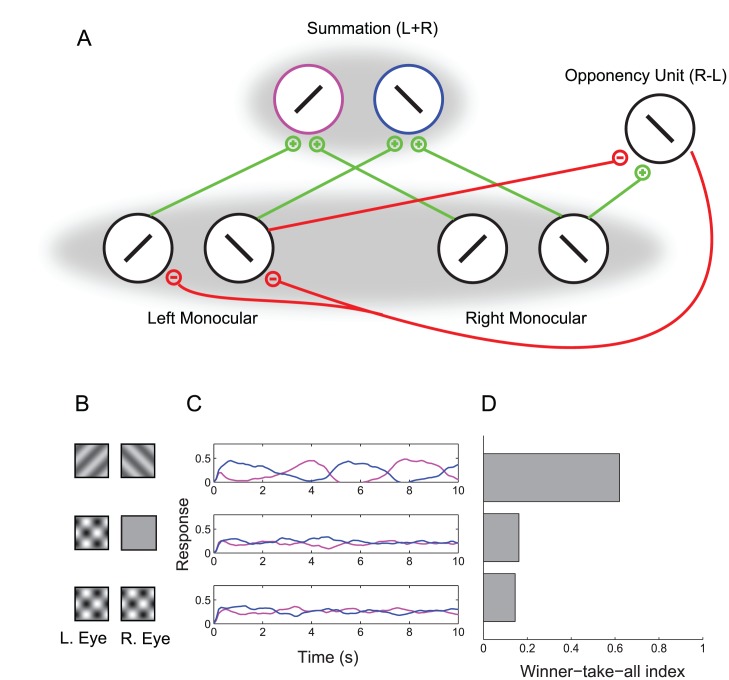
Figure 5. Ocular opponency model.
(A) Schematic. An opponency neuron computes a response difference between the two eyes for a particular orientation preference and retinotopic location. The opponency neuron inhibits activity in the opposite eye (curved red line), thus amplifying the winner-take-all behavior of normalization (gray shadow). Not shown are three other opponency neurons (a R-L neuron selective for the orthogonal orientation, and two L-R neurons). Also not shown are the two normalization pools for the opponency neurons (one for R-L opponency neurons, and another for L-R opponency neurons). (B–D) Model simulations (same format as Figure 2). The opponency model shows dichoptic grating rivalry that is much stronger than plaid component rivalry.

