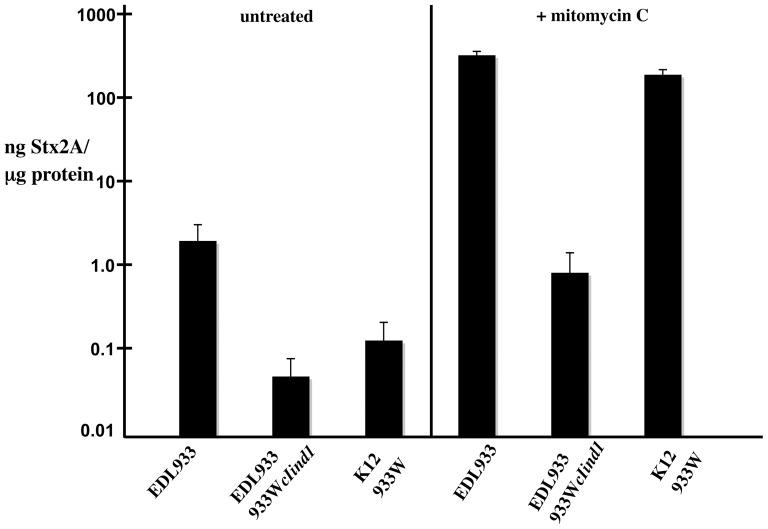
Figure 3. Expression of Stx.
Levels of Stx were determined as outlined in Materials and Methods. Mitomycin C was used at a concentration of 2 µg/ml. Strains: EDL933, EDL933cIind1 (K11349), and K37-933W (K9675). Error bars indicate standard deviations. P values (mc = mitomycin C treated): (1) EDL933×EDL933 (mc) = 6.6×10⁻⁷; (2) EDL933×K11349 = 0.0056; (3) K11349×K11349 (mc) = 0.018; (4) EDL933×K9675 = 0.0069; (5) K9675×K9675 (mc) = 3.5×10⁻⁶; (6) EDL933 (mc)×K9675 (mc) = 0.00044.

