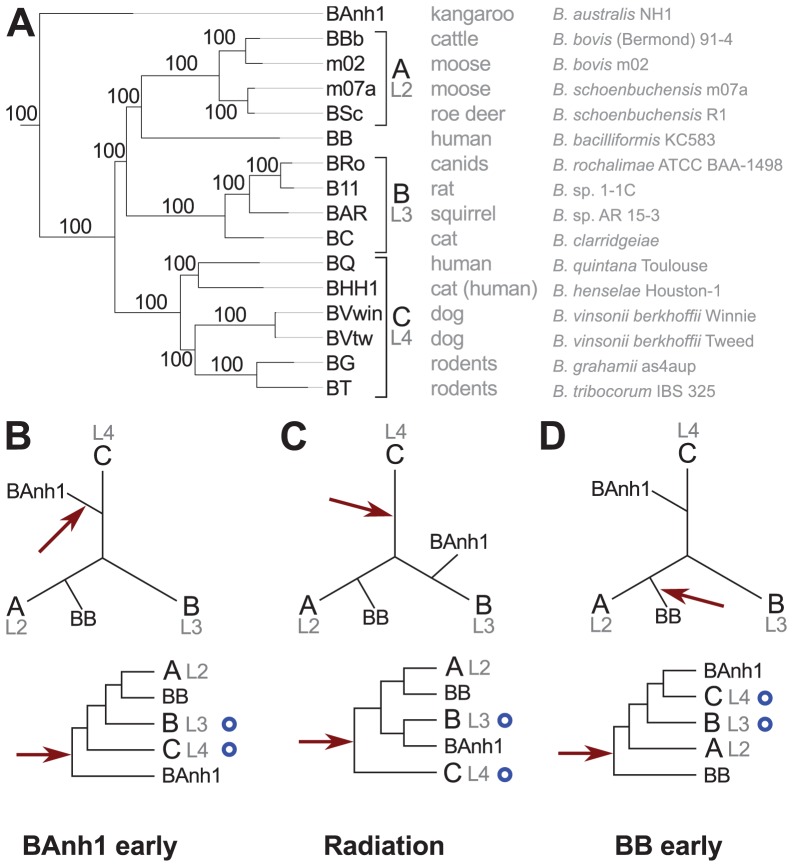
Figure 1. Phylogenetic relationships of the Bartonella species examined in this study.
Phylogenetic tree inferred from a maximum likelihood analysis of a concatenated alignment of 428 genes (A) and three schematic figures showing different placements of B. australis (BAnh1) and the root (B–D). The most common host of each strain and the full name of the strain are indicated next to the tree in (A). Numbers on the branches indicate bootstrap support in the maximum likelihood phylogeny. Lineages (L2-4) refer to the nomenclature used in [13]. The schematic phylogeny depicted in (B) is taken from the phylogenetic analyses presented in Figure S5A, which suggest that B. australis diverges early (“BAnh1 early”). (C) The schematic phylogeny depicted in (B) is taken from the phylogenetic analyses presented in Figure S5C, which suggests that B. australis is a sister clade to group B (“Radiation”). The schematic phylogeny depicted in (D) is taken from the phylogenetic analyses presented in [13], which suggest that B. bacilliformis (BB) diverges early (“BB early”). The position of the root is depicted with a red arrow (B–D). Blue circles indicate the presence of the VirB type IV secretion system.

