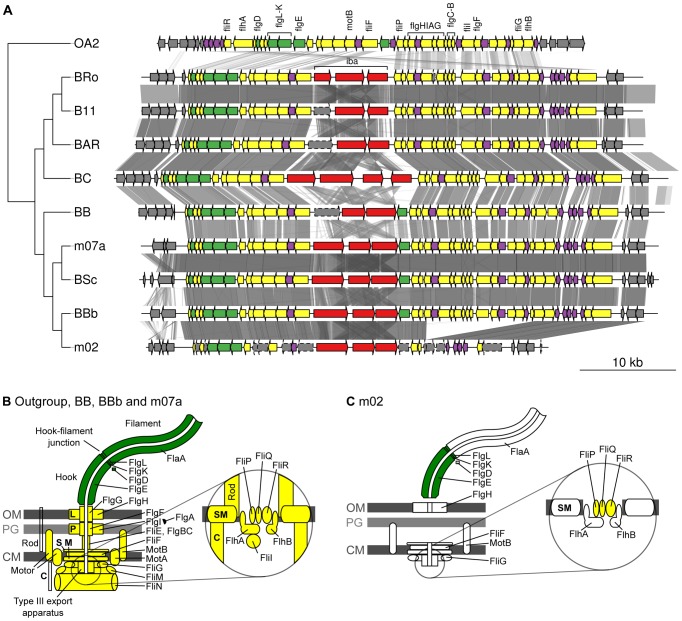
Figure 6. Gene order structures of the segment encoding the flagellum.
Comparative analysis of the DNA segments covering the gene cluster for the flagellum (A). Tblastx hits between genomes are shown between the gene clusters, with grey intensity reflecting the e-value of the hit. The tree is a schematic representation of the phylogeny of the Bartonella species that contain a gene cluster for the flagellum, taken from Figure 1A. The outgroup OA2 is Ochrobactrum anthropi chromosome 2. Schematic representations of the flagellar protein complexes in species where the gene cluster is complete (B) and in B. bovis strain m02 where several genes are missing and other genes contain frameshift mutations (C). Genes and proteins are colored according to their presumed function and location: Extracellular proteins (green), membrane and intracellular proteins (yellow), hypothetical proteins (purple).

