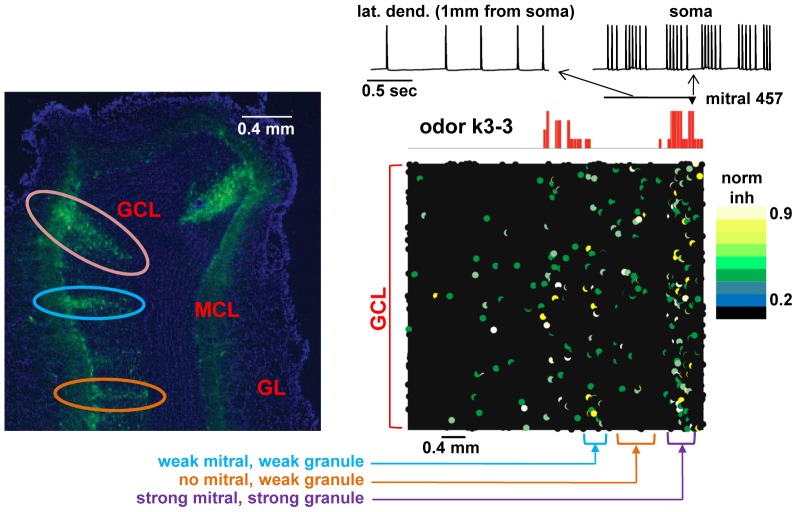
Figure 9. Emergence of distributed mitral-granule cell connectivity.
(Left) Typical experimental findings for pseudorabies virus staining patterns after olfactory bulb injection (adapted from Fig. 2D of [10] with permission from the National Academy of Sciences, U.S.A); the photo shows a coronal section of the olfactory bulb, with labeling of columns of granule cells; GCL, granule cells layer; MCL, mitral cells layer; GL, glomerular layer; colored loops indicate regions of strong (purple), medium (blue), and weak (orange) cell activation. (Right) Model results after learning of odor k3-3. The top traces show bursts in the soma (right) that become single spikes as they propagate in a lateral dendrite (left) of mitral cell 457 at the end of the learning period (t = 8–9 sec). The red histogram represents the strength of glomerular input to the mitral cell tuft (see Fig. 2B), and the field shows the location and normalized peak inhibitory conductance from granule cells on the mitral cell lateral dendrites (see color bar: strong conductance in yellow; moderate in green; low or absent in black). Note that the locations of strong conductances line up primarily with sites of mitral cell responses but also occur in the intervening spaces (see text). Regions similar to the experimental patterns are indicated with different colors (purple, blue, orange).

