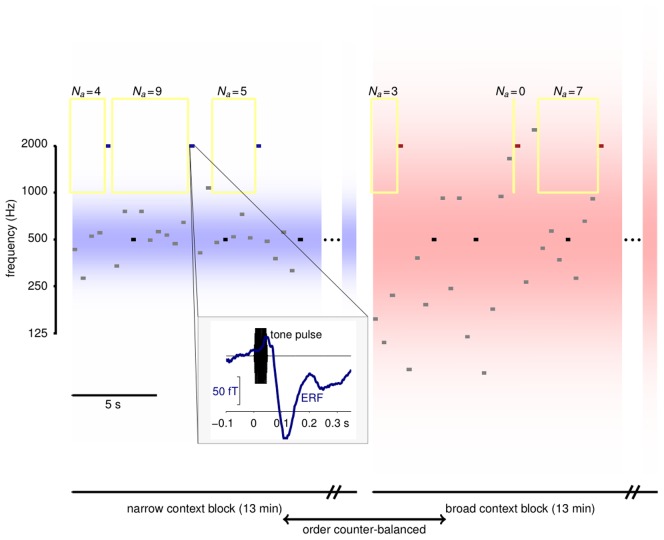
Figure 1. Experimental design.
Tone pulse sequences were presented in blocks. The frequencies of the majority of tones in each block (grey) were drawn from a contextual distribution that could be narrow (left) or broad (right). The distribution densities are shown in blue and red shading; both were centred at 500 Hz and had standard deviations of 0.5 and 1.5 octaves respectively. Embedded in both sequences were probe tones whose frequencies were either equal to the distribution centres (standard, black), or 2 octaves above (odd, blue and red). Yellow rectangles indicate frequency exclusion windows used for the local adaptation analysis of Figure 5; the associated values of  give the number of preceding tones that fell outside the adaptation window. Block lengths are indicated for Experiment 2. Blocks in Experiment 1 were shorter and repeated more often. Inset: The timing of tones and MEG epochs. Tone pulse waveforms (black) lasted 50 ms with ramped onsets and offsets. MEG responses (blue) were extracted from 100 ms before to 350 ms after tone onset. The evoked response shown is the average response to odd probes in the narrow context, spatially filtered as in Figure 5.

