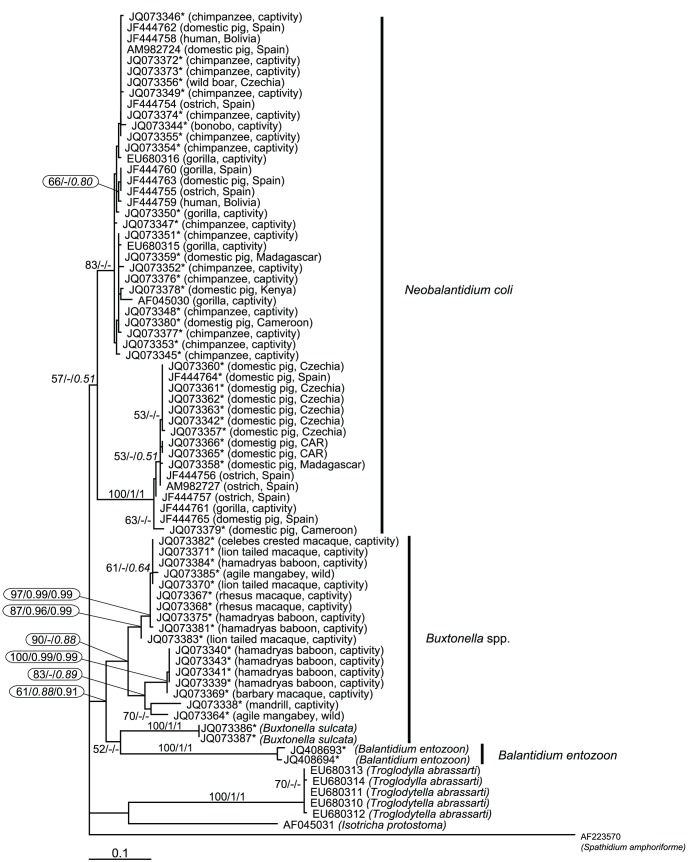
Figure 2. Maximum likelihood phylogenetic tree as inferred from the ITS1-5.8S-ITS2 DNA region.
The tree was computed using PhyML with the GTR model for nucleotide substitutions. Numbers above branches indicate ML bootstrap support from 1000 replicates/PhyloBayes posterior probabilities computed with CAT model/PhyloBayes posterior probabilities computed with GTR model. New sequences are marked with a star.

