
Figure 5. Differential ZAP-70 affinity and sequential phosphorylation produces ultrasensitivity.
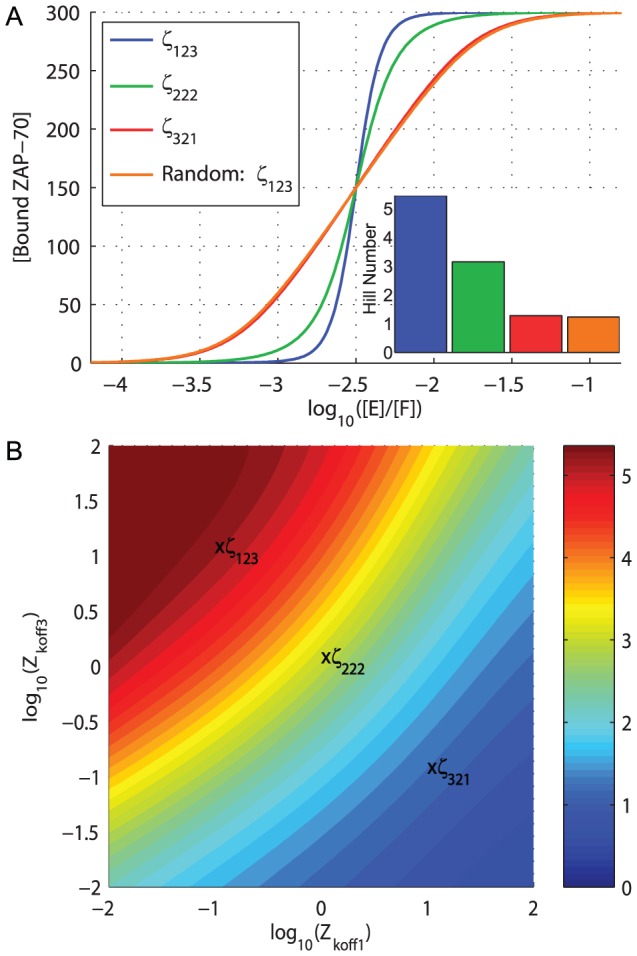
A) The concentration of bound ZAP-70 as a function of the relative concentration of active kinase (E) to phosphatase (F). Shown are the wild-type  -chain (
 123), and additional constructs where all ITAMs are identical (
 222), switched (
 321), or where phosphorylation is no longer sequential (
 123 Random). The Hill numbers (inset) reveal that ultrasensitivity is decreased if ZAP-70 does not exhibit differential affinity (
 222), if the affinity decreases as the
  is sequentially phosphorylated (
 321), or if phosphorylation is no longer sequential. B) Heat map of Hill numbers as a function of the ZAP-70 unbinding rate for ITAM 1 (Z
 ) and ITAM 3 (Z
 ), where the unbinding rate for ITAM 2 is fixed at 1 s−1. The calculation is performed under sequential phosphorylation. Maximum sensitivity is found in the top left of the heat map, where ZAP-70 binds with the largest affinity to ITAM 1 and with lowest affinity to ITAM 3. The heat map is repeated using an alternate measure of sensitivity in Fig. S3. Note that the heat map colour scheme in panel B is not related to the colour scheme in panel A.