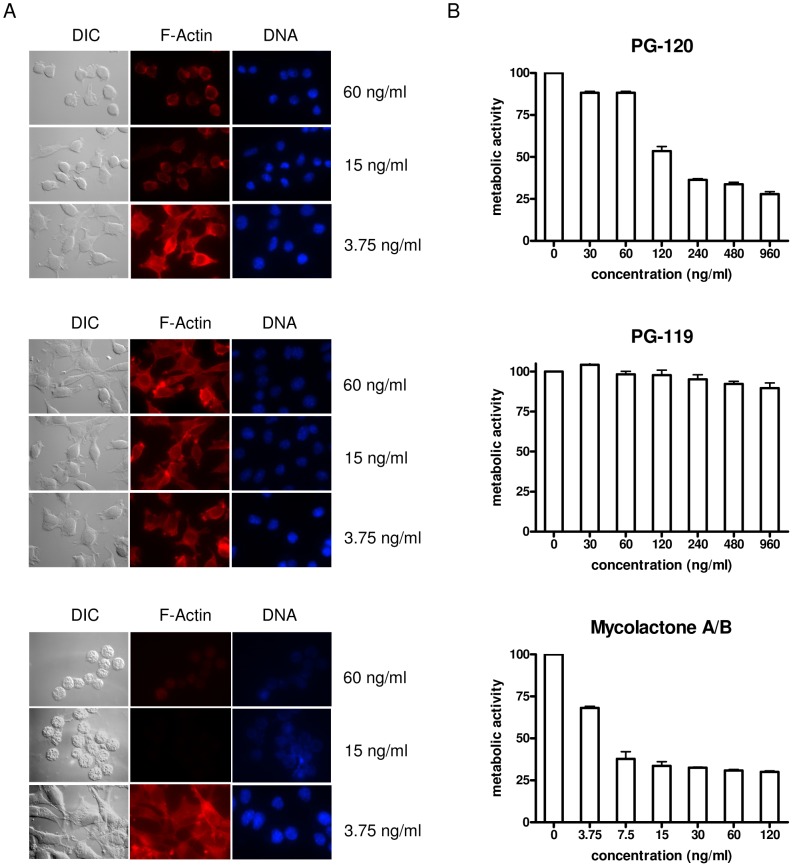
Figure 5. Changes in morphology and metabolic activity of L929 fibroblasts upon treatment with PG-120, PG-119 and mycolactone A/B.
(A) For microscopic analysis, cells incubated for 48 h with selected concentrations of mycolactones were stained with phalloidin to label the actin cytoskeleton (red) and with DAPI (blue) to visualize the nuclei. The slides were analyzed by fluorescence microscopy using a 787-fold magnification. (B) For the analysis of metabolic activity, alamarBlue® reagent was added to fibroblasts incubated for 48 hours with different concentrations of PG-120, PG-119 or mycolactone A/B. Fluorescence intensities of triplicate samples were measured and mean values as well as standard deviations are shown.

