
Figure 5. APOBEC3G expression is reduced in the thymus.
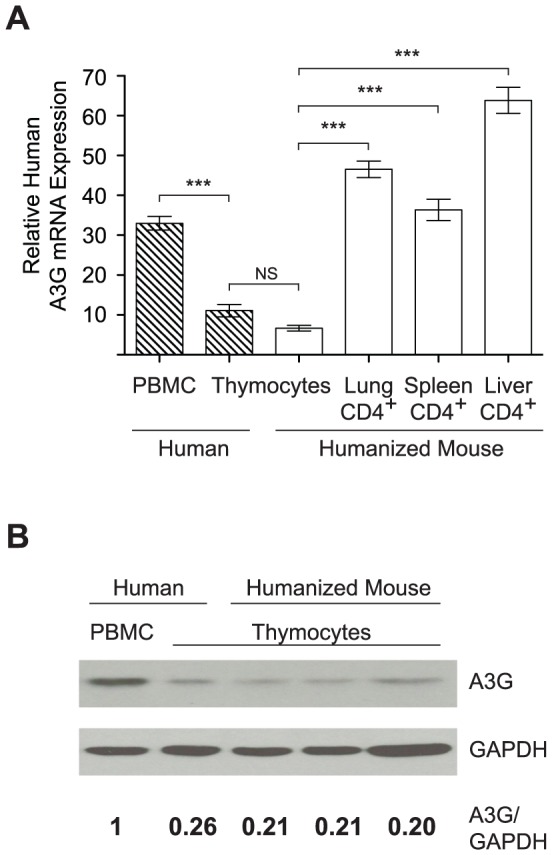
(A) Human A3G mRNA levels from human PBMC (n = 7), human thymus (n = 6), NSG-BLT humanized mouse thymus (n = 18), and CD4+ cells from NSG-BLT humanized mouse lung (n = 6), spleen (n = 7), liver (n = 7) were determined using qRT-PCR and normalized to human TATA Box binding protein. Hatched bars represent human cells; open bars represent humanized mouse cells. NS = not significant, *** p<0.01 by one way ANOVA with Bonferroni's posttest. Data represent mean +/− SEM. (B) Immunoblot for human A3G and GAPDH from human PBMC and cells from human and humanized mouse thymus. Numbers represent A3G normalized to GAPDH compared to human PBMC which is set to 1.