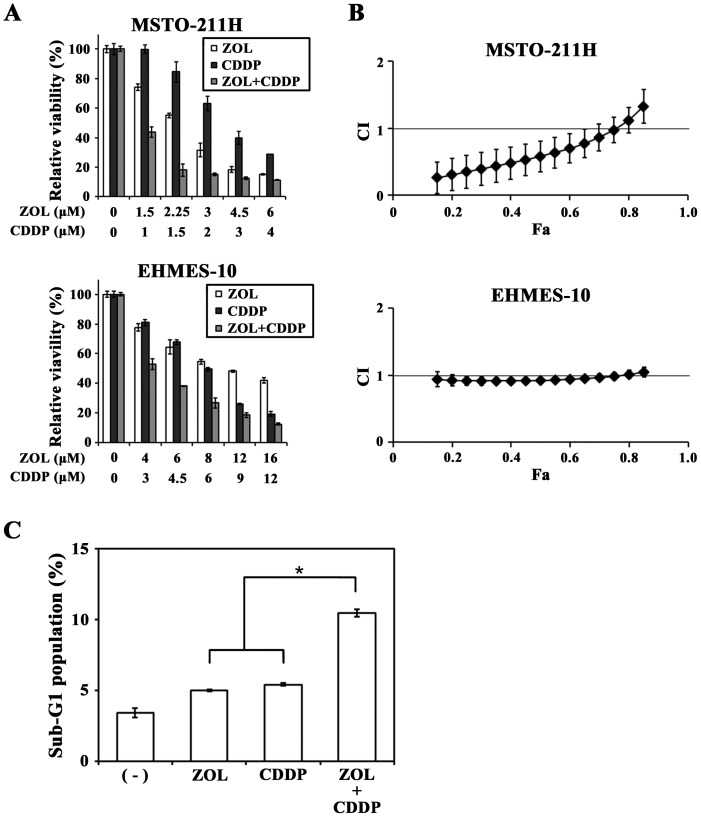
Figure 2. Combinatory effects of ZOL and CDDP.
(A) Cells were treated with different doses of ZOL and CDDP at a constant concentration ratio (ZOL∶CDDP = 3∶2 at each concentration in MSTO-211H and 4∶3 in EHMES-10 cells) for 3 days and the cell viabilities were measured with the WST assay. Means of triplicated samples and the SD bars are shown. (B) CI values based on the cell viabilities as shown in (A) were calculated at different Fa points with CalcuSyn software. The SE bars are also indicated. (C) Sub-G1 phase populations of PI-stained MSTO-211H cells that were treated with ZOL (15 µM) and/or CDDP (4 µM) for 24 h were calculated with flow cytometry. Means of triplicated samples and the SE bars are shown. * P<0.01.

