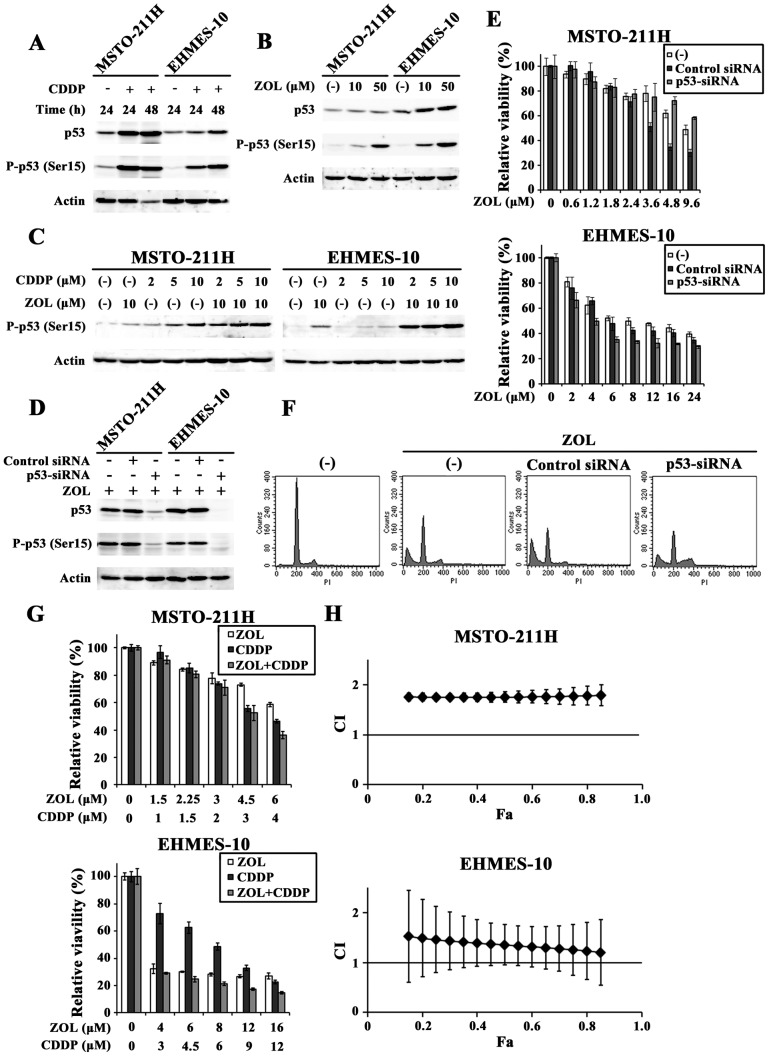
Figure 4. ZOL-induced up-regulation of p53 and knockdown of the p53 expressions with siRNA.
(A, B) CDDP-treated (20 µM) and ZOL-treated (48 h) cells were subjected to Western blot analysis and probed with antibodies as indicated. Actin was used as a loading control. (C) Cells were treated with CDDP and/or ZOL for 48 h at the indicated concentrations and the expression levels of phosphorylated p53 were examined. (D) Cells were transfected with p53-targeted siRNA (p53-siRNA) or non-targeted control siRNA (Control) for 24 h and then treated with ZOL (50 µM) for 48 h. The lysate was subjected to Western blot analysis. (E) Cells were transfected with siRNA as indicted and were treated with ZOL for 3 days. The cell viabilities were measured with the WST assay and means of triplicated samples with the SD bars are shown. (F) Flow cytometrical analyses of MSTO-211H cells that were transfected with respective siRNA for 24 h and then treated with ZOL (50 µM) for 48 h. (G, H) Cells transfected with p53-siRNA were treated with different doses of ZOL and CDDP as indicated for 3 days and the CI values based on the cell viabilities were calculated at different Fa points with CalcuSyn software.

