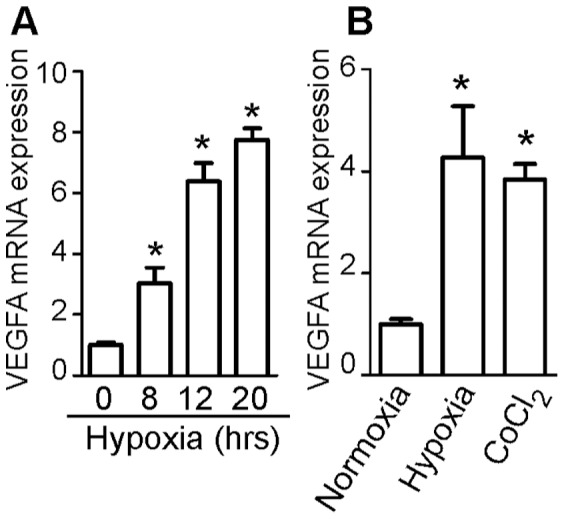
Figure 5. VEGFA mRNA induction during hypoxic response of HCT116 cells.

Real-time PCR analysis of VEGFA mRNA induction in wild type HCT116 cells exposed to the indicated times of hypoxia (A) and in pchMR-transfected HCT116 cells exposed to normoxia, hypoxia or CoCl2 treatment (B). In panel A, values of VEGFA mRNA expression for each sample were compared to that of time 0, set as 1. In panel B, values of VEGF mRNA expression of pchMR-transfected cells exposed to hypoxia or CoCl2 treatment were compared to that of pchMR-transfected control cells exposed to normoxia, set as 1. Results are expressed as Mean±SEM (n = 3–4). * p<0.05 ANOVA followed by Bonferroni t-test.
