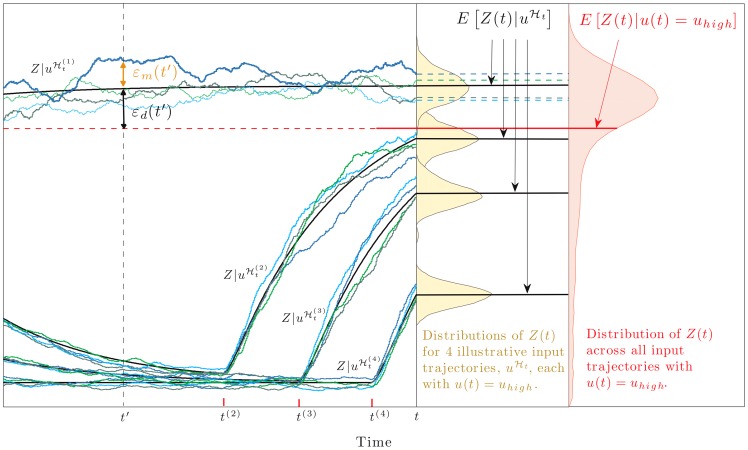
Figure 2. Dynamical error as the difference between two conditional expectations.
To illustrate, we consider a 2-stage model of gene expression with the input,  , equal to the current rate of transcription, and the signal of interest
  . We model
  as a 2-state Markov chain and show simulated trajectories of the protein output,
  , corresponding to four different input trajectories,
  . These input trajectories (or histories) all end at time
  in the state
  (not shown) and differ according to their times of entry into that state (labelled
  on the time axis;
  is off figure).
  (black lines) is the average value of
  at time
  given a particular history of the input
  : the random deviation of
  around this average is the mechanistic error
  (shown at time
  for the first realisation of
  ).
).  is the average or mean value of
  given that the trajectory of
  ends in the state
  at time
  .
.  (red line) can be obtained by averaging the values of
  over all histories of
  ending in
  . The mean is less than the mode of the distribution for
  because of the distribution's long tail.
  , not shown, is obtained analogously. The dynamical error,
  , is the difference between
  and
and  and is shown here for the first trajectory,
  . Fig. 3B shows data from an identical simulation model (all rate parameters here as detailed in Fig. 3B).

