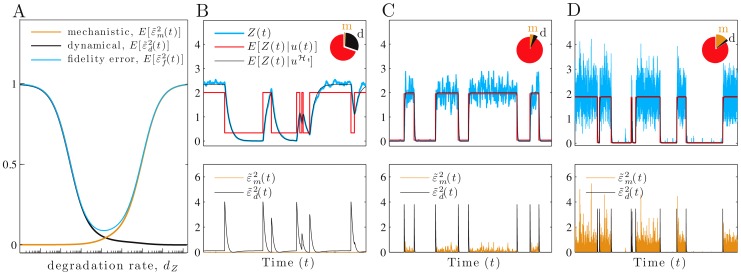
Figure 3. As the protein lifetime decreases, a trade-off between dynamical and mechanistic error determines fidelity.
We consider a 2-stage model of gene expression with the input,  , equal to the current rate of transcription, and the signal of interest
  . (A) The magnitude of the relative fidelity errors as a function of the protein degradation rate,
  (from Eqs. 11, 12 and 13), using a logarithmic axis. (B–D) Simulated data with
  as in Fig. 1A. The units for
  are chosen so that its variance equals one in each case (hence
  and
and  ). Pie charts show the fractions of the protein variance due to the mechanistic (m) and dynamical (d) errors and to the transformed signal. The latter equals
  . In B, the relative protein lifetime,
  , is higher than optimal (
 ) and fidelity is 2.2; in C,
  is optimal (
 ) and fidelity is 10.1; and in D,
  is lower than optimal (
 ) and fidelity is 5.3. Dynamical error,
  , is the difference between
  (black) and the faithfully transformed signal
  (red), and decreases from B to D, while mechanistic error increases. The lower row shows the magnitudes of the relative dynamical error (black) and relative mechanistic error (orange). All rate parameters are as in Fig. 1 A&C with
  , unless otherwise stated.

