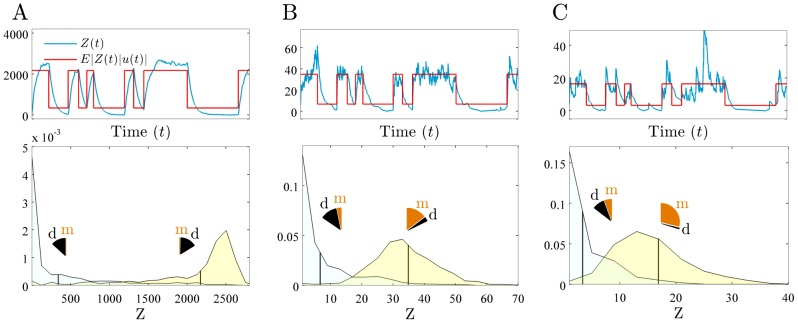
Figure 4. Increasing the strength of negative feedback decreases fidelity.
We consider a 2-stage model of gene expression with the signal of interest  , and with
  proportional to the level of a transcriptional activator. We simulate
  as in Fig. 1A. Upper row compares the time course of the protein output (blue) to the faithfully transformed signal (red),
  . Lower row shows the distributions for the output,
  , that correspond to each of the two possible values of the input,
  (low and high). Vertical lines indicate the means of the distributions. Pie charts show the fractions of the variance of each (conditional) distribution due to dynamical (d) and mechanistic (m) error, weighted by the probability of the input state: summing these gives the overall magnitude (variance) of the dynamical and mechanistic errors. (A) No feedback (
 ), fidelity equals 2.4. (B) Intermediate feedback (
 ), fidelity equals 2.0. (C) Strong feedback (
 ), fidelity equals 1.3. As the strength of feedback increases, the underlying state of the input is more difficult to infer (the conditional distributions overlap more) because increasing (relative) mechanistic error dominates the decreasing (relative) dynamical error. Note the decrease in the (relative) dynamical error when
  is in its high state (yellow conditional distribution) because stronger negative feedback gives faster initiation of transcription. Transcription propensities are given by
  , and all parameters except
  are as in Fig. 3B.

