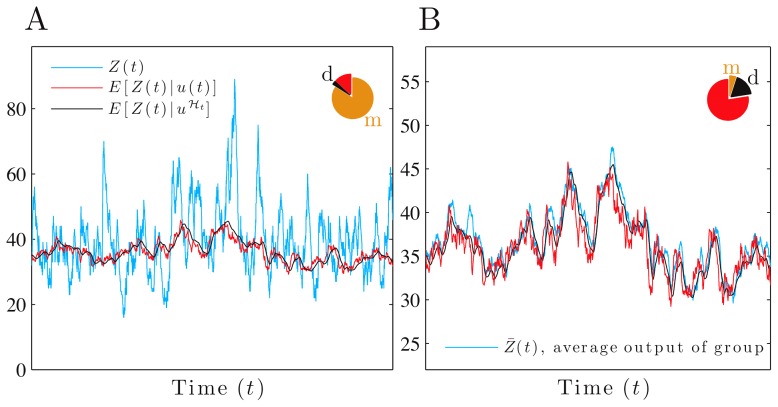
Figure 5. The fidelity of the collective response of a group of cells exceeds that of a single cell.
We consider a 2-stage model of gene expression with the signal of interest  , and with
  proportional to the level of a transcriptional activator and modeled as an Ornstein-Uhlenbeck process. The unconditional distribution of
  is therefore Gaussian. Pie charts show fractions of the protein variance due to the mechanistic (m) and dynamical (d) errors and are computed using our Langevin method (SI). (A) For a single cell with negative autoregulation (
 ), fidelity is low and equal to 0.2, with a dominant mechanistic error. (B) For 100 identical and independent cells (given the input's history), with negative autoregulation (
 ): fidelity between
  and the average protein output for the group is higher and equal to 3.5. All parameters as in Fig. 3B except
  .
.

