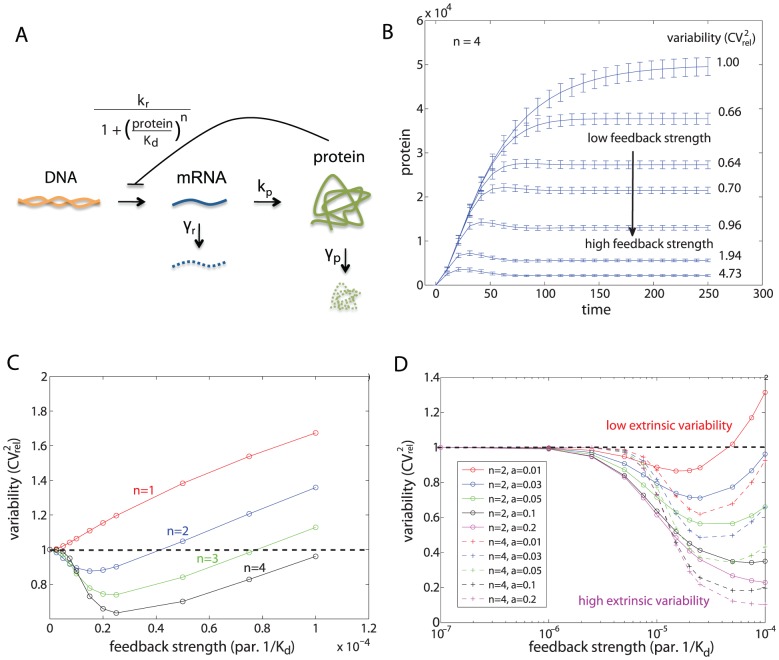
Figure 4. Results for the single gene expression model.
(A) Single gene expression model with transcriptional self-repression. (B) Examples of protein distribution dynamics under no feedback (top-most) and under negative feedback. Increased feedback strength ( top to bottom) resulted in lower means and variances. Reported are the measures of variability calculated for the steady-state distribution with Hill coefficient
  . (C) Effect of self-repression on variability when intrinsic stochasticity is the only source of variability, for Hill coefficient values of
  . (D) Effect of self-repression on the system with both intrinsic and extrinsic variability. Extrinsic variability is introduced into the transcription rate. Extrinsic variability in parameters (eqn. (13)):
  (red),
  (blue),
  (green),
  (black),
  (magenta) with Hill coefficient
  (full line; o),
  (dashed line; +).

