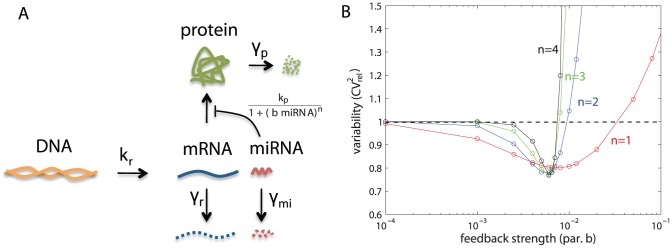
Figure 10. Results for post-transcriptional self-repression modeled by a Hill function.

(A) Single gene expression model with post-transcriptional self-repression modeled by a Hill function. (B) Effect of self-repression on variability with only intrinsic sources of variability, for Hill coefficient values of  .
.
