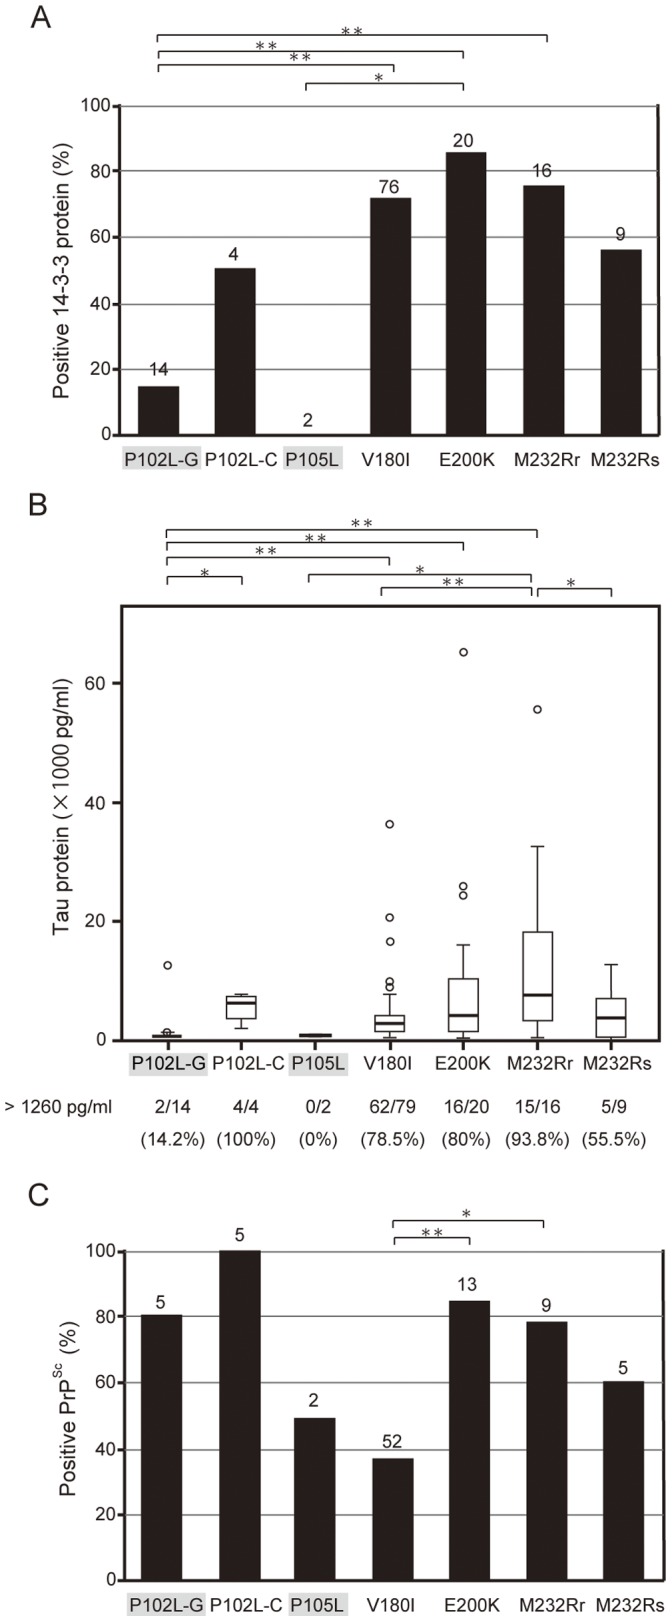
Figure 2. Relationships between CSF biomarkers and genotypes.

(A) Rates of positivity of 14-3-3 protein in the CSF of 141 gPrD patients. The number of patients for whom data were available is shown at the top of each column. (B) Box-and-whisker plots of the concentrations of tau proteins in the CSF of 144 gPrD patients. The number of patients with a tau concentration of 1260 pg/mL or greater and the detection rate for each mutation are shown below the graph. (C) Positivity rates of PrPSc protein in the CSF of 91 gPrD patients. *P<0.05; **P<0.005 (Fisher’s exact probability test).
