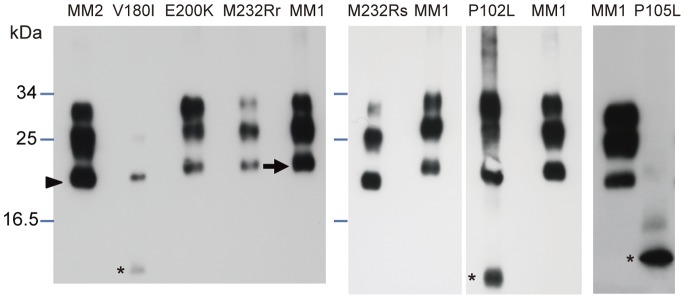
Figure 5. Western blot analysis of PrPSc in PK-treated brain homogenates.

MM2-type sCJD, V180I, E200K (1∶30 dilution of homogenate), M232R-rapid (1∶10 dilution), M232R-slow, P102L-GSS, and P105L (a different case from that in Figure 2). The 3 different molecular-weight bands from large to small correspond to di-, mono-, and unglycosylated fragments. Bands with a shorter migration distance indicate PrPSc subtype 1 (arrow), which is processed at residues 74–97, whereas bands with a longer migration distance indicate subtype 2 (arrowhead), which is processed at residues 82–102. There were additional bands of smaller molecular weight in the V180I, P102L-GSS, and P105L samples (asterisks).
