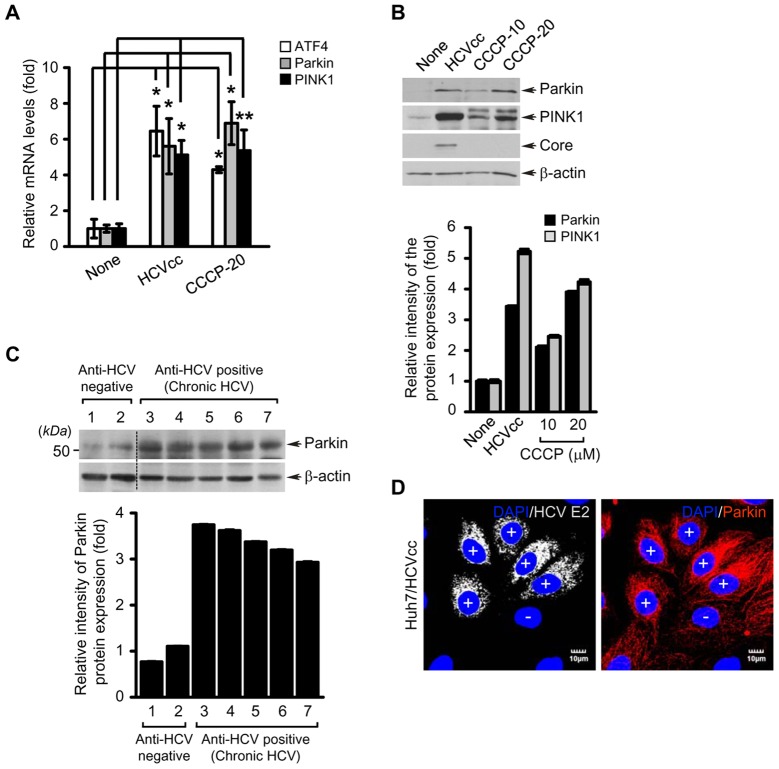
Figure 3. HCV infection stimulates ATF4, Parkin, and PINK1 gene expression.
(A and B) Quantitative analyses of ATF4, Parkin, and PINK1 gene expression in HCV-infected cells. Huh7 cells infected with HCVcc for 5 days or treated with CCCP (10 or 20 µM) for 24 h were used for analysis of ATF4, Parkin, and PINK1 gene expression. (A) Intracellular mRNA levels of ATF4, Parkin, and PINK1 were analyzed by real-time qRT-PCR. GAPDH was used to normalize changes in Parkin and PINK1 gene expression (mean ± SD; n = 3; *p<0.01, **p<0.05). P values were calculated by using an unpaired Student's t-test. (B) The protein expression levels of Parkin and PINK1 were analyzed by immunoblotting with anti-Parkin and PINK1 antibodies. The expression of HCV core protein was analyzed by immunoblotting with anti-HCV core antibody. β-actin was used as an internal loading control. (C) Western blot analysis of Parkin expression in liver biopsies of chronic hepatitis C patients. Samples 1 and 2 represent liver biopsies of HCV-negative patients and samples 3–7 represent HCV-positive chronic hepatitis patients. (B and C) The relative intensity of Parkin and PINK1 expression normalized to β-actin analyzed by ImageJ. (D) Confocal microscopy showing Parkin overexpression in HCV-infected cells. Huh7 cells infected with HCVcc were immunostained with anti-Parkin antibody (red). Fluorescence image of HCV E2 verifies HCV-infected cells (light gray). Nuclei were stained with DAPI (blue). Infected (+) and uninfected cells (−) are marked.

