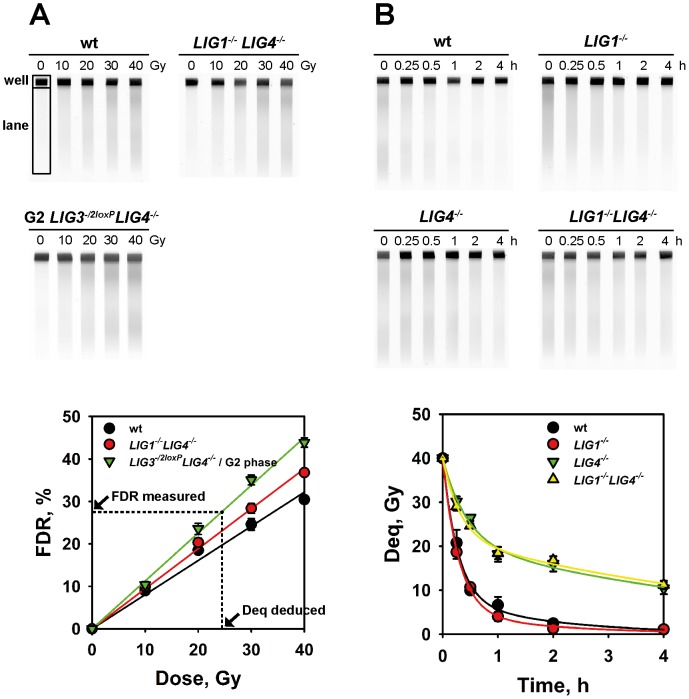
Figure 1. LIG3 processes IR-induced DSBs in LIG1 and LIG4 deficient cells.
(A) Representative dose response curves for the induction of DSBs, as measured by PFGE, in cells exposed to increasing doses of X-rays. Images of ethidium bromide stained gels (upper panel) were analyzed to estimate the fraction of DNA released (FDR) from the well into the lane (regions defined as indicated) that is plotted as a function of IR dose for the indicated mutants (lower panel). Results from three independent experiments with 3 samples each were used to calculate the indicated means and standard errors. The dotted lines indicate the approach used to deduce Deq from FDR in DSB repair experiments (see text for details). (B) Repair kinetics of IR-induced DSBs in asynchronous wt, LIG1−/−, LIG4−/−, and LIG1−/−LIG4−/− cells after exposure to 40 Gy X-rays. The upper panel shows typical gels used to calculate the FDR at each repair time point, which was subsequently converted to Deq with the help of dose response curves such as those shown in A but generated with the same cell population used in the repair experiment (see text for details). Results of three determinations from at least two independent experiments were used to calculate the indicated means and standard errors (lower panel).

