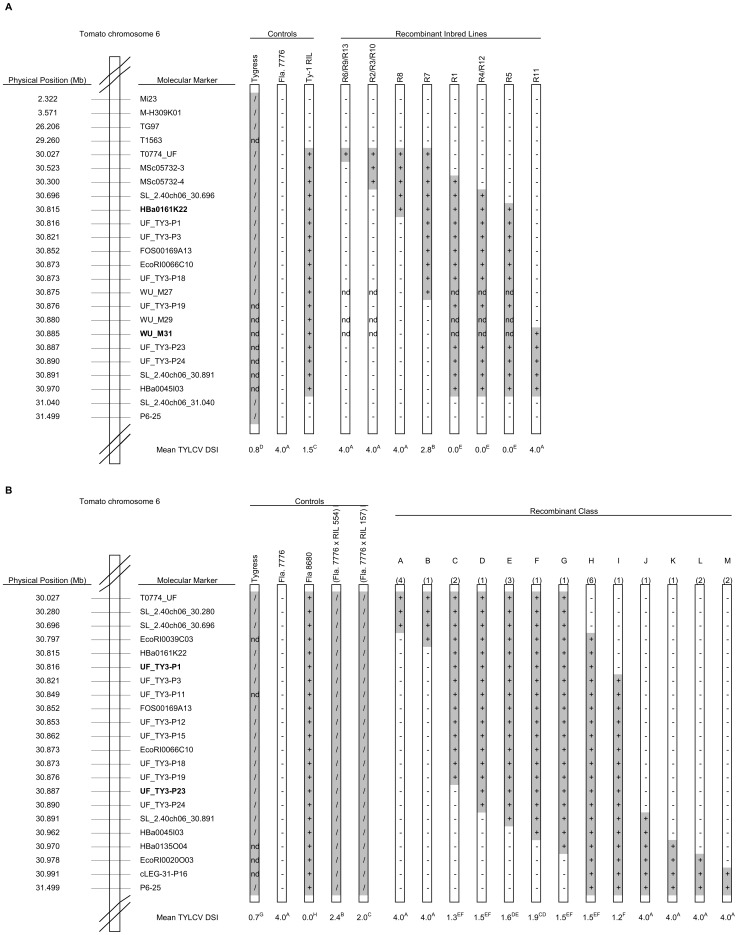
Figure 1. Physical maps showing control lines and introgressed fragments in the RILs used to map Ty-1 and Ty-3.
Introgressed segments of the S. chilense genome are shaded grey; genotype for each line at each marker is indicated (+ = homozygous S. chilense; / = heterozygous; − = homozygous S. lycopersicum; nd = not determined). Approximate physical positions are based on the tomato genome assembly SL_2.40, available through the Sol Genomics Network (SGN; http://solgenomics.net/). DSI = mean disease severity index as described in the Materials and Methods; within either population, different superscript letters represent statistically significant differences at P<0.05 based on Duncan's multiple range test. A: Control lines and RILs used for mapping of Ty-1. Flanking markers of the Ty-1 region, HBa0161K22 and WU_M31, are depicted in bold. B: Control lines and RILs used for mapping of Ty-3. The number of recombinants recovered in each class is given in parentheses above each recombinant chromosome. Flanking markers, UF_TY3-P1 and UF_TY3-P23 of the Ty-3 region are depicted in bold.

