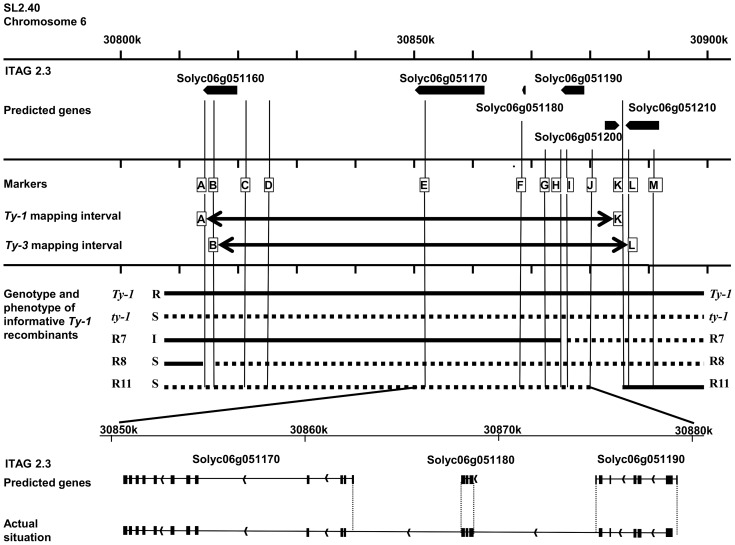
Figure 2. Schematic representation of the region of interest of chromosome 6.
Depicted is the region 30,800,000 to 30,900,000 of chromosome 6 with the genomic annotations of the ITAG2.3 release [36]. In the first frame the six predicted genes are represented by arrows. In the next frame the markers used to genotype the recombinants in this study are shown (A = HBa0161K22, B = UF_TY3-P1, C = UF_TY3-P3, D = WU_M17, E = FOS00169A13, F = WUR_M25, G = UF_TY3-P18, H = WU_M27, I = UF_TY3-P19, J = WU_M29, K = WU_M31, L = UF_TY3-P23, M = UF_TY3-P24). In this frame also the Ty-1 and Ty-3 intervals with their flanking markers are depicted. The third frame shows the genotype of the informative recombinants used to fine map Ty-1, R7, R8 and R11, note that only for R7 the precise recombination point is known (Figure S2). Also their phenotype upon TYLCV challenge inoculation is shown (Resistant (R), Susceptible (S) and Intermediate (I)). The last frame shows the predicted splicing of gene Solyc06g051170, Solyc06g051180 and Solyc06g051190 compared with the actual situation; differences are indicated with dotted lines.

