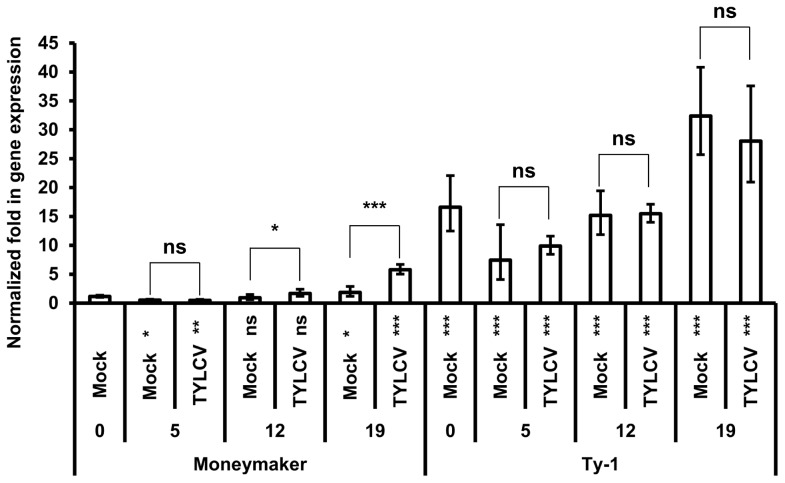
Figure 6. Ty-1 expression is elevated in resistant lines.
Normalized fold in gene expression of the ty-1 (susceptible) and Ty-1 (resistant) allele. Numbers below x-axis indicate days after inoculation. Values are normalized against the Moneymaker day 0 sample, bars represent means and standard deviation of five biological replicas. Asterisks under the x-axis represent significant differences to the Moneymaker day 0 sample, asterisks above the bars represent significant differences between Mock or TYLCV treatment. (* = P<0.05, ** = P<0.01, *** = P<0.001, ns = not significant).

